Recent Posts
-
Terminal Latency on Windows
UPDATE 2024-04-15: Windows Terminal 1.19 contains a fix that reduces latency by half! It’s now competitive with WSLtty on my machine. Details in the GitHub Issue.
In 2009, I wrote about why MinTTY is the best terminal on Windows. Even today, that post is one of my most popular.
MinTTY in 2009 Since then, the terminal situation on Windows has improved:
- Cygwin defaults to MinTTY; you no longer need to manually install it.
- Windows added PTY support, obviating the need for offscreen console window hacks that add latency.
- Windows added basically full support for ANSI terminal sequences in both the legacy conhost.exe consoles and its new Windows Terminal.
- We now have a variety of terminals to choose from, even on Windows: Cmder, ConEmu, Alacritty, WezTerm, xterm.js (component of Visual Studio Code)
The beginning of a year is a great time to look at your tools and improve your environment.
I’d already enabled 24-bit color in all of my environments and streamlined my tmux config. It’s about time that I take a look at the newer terminals.
Roughly in order, I care about:
- Minimum feature set: 24-bit color, reasonable default fonts with emoji support, italics are nice.
- Input latency.
- Throughput at line rate, for example, when I
cata large file. - Support for multiple tabs in one window would be nice, but tmux suffices for me.
Which terminals should I test?
I considered the following.
- Legacy conhost.exe (also known as Windows Console), Windows 10 19045
- MinTTY (3.7.0)
- Alacritty (0.13.1)
- WezTerm (20240203-110809-5046fc22)
- Windows Terminal (1.18.10301.0)
Testing Features
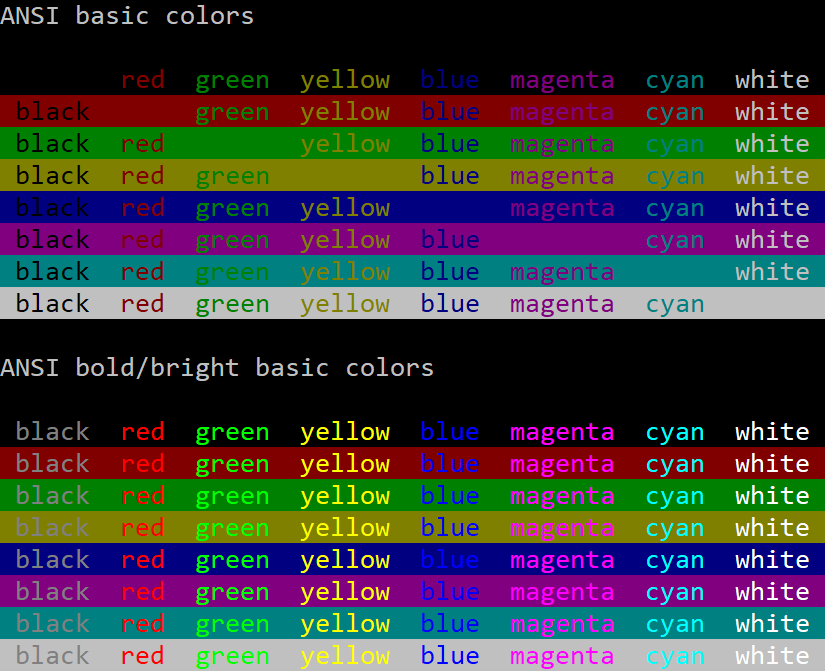
Testing color and italics support is easy with my colortest.rs script. To test basic emoji, you can cat the Unicode emoji 1.0 emoji-data.txt. To test more advanced support, try the zero-width joiner list in the latest/ directory.
Terminal Emoji Font Attributes conhost.exe No No italics MinTTY Black and white All major attributes Alacritty Black and white Everything but double underline WezTerm Color All major attributes Windows Terminal Color All major attributes Everything but conhost.exe meets my bar.
It’s also worth noting that conhost.exe has a terrible default palette. The default yellow is a pukey green and dark blue is barely visible. You can change palettes, but defaults matter.
Conhost.exe Default Palette 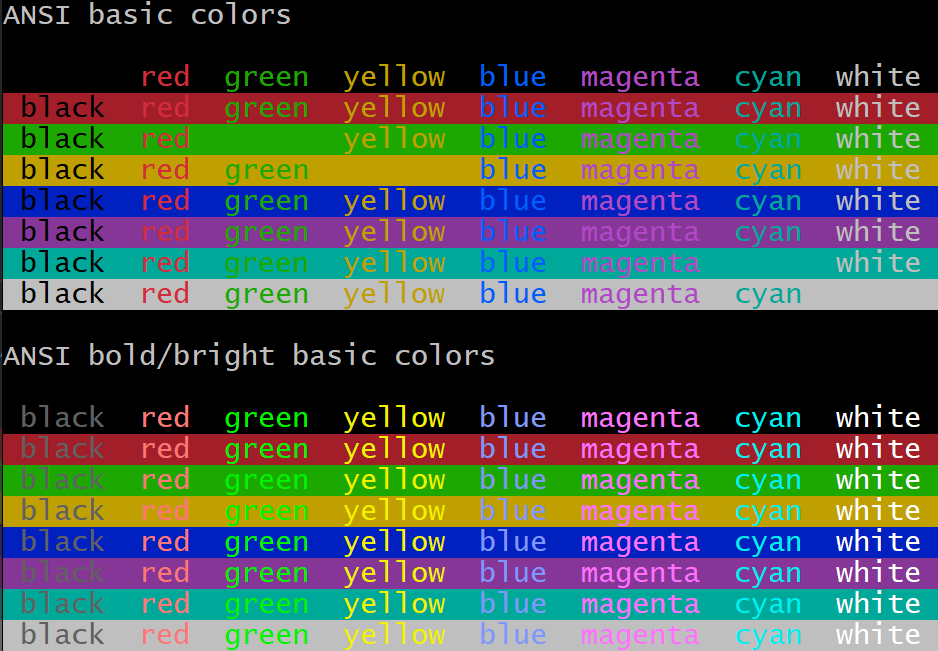
MinTTY Default Palette Latency
I set up two latency tests. One with an 80x50 blank window in the upper left corner of the screen. The other fullscreen, editing an Emacs command at the bottom of the screen.
Since latencies are additive, system configuration doesn’t matter as much as the absolute milliseconds of latency each terminal adds, but I’ll describe my entire setup and include total keypress-to-pixels latency.
- Windows 10
- Intel i7-4771 @ 3.5 GHz
- NVIDIA GTX 1060
- Keyboard: Sweet 16 Macro Pad
- Display: LG 27GP950-B at 4K, 120 Hz, adaptive sync
Measurement Methodology
With Is It Snappy?, I measured the number of frames between pressing a key and pixels changing on the screen.
To minimize ambiguity about when the key was pressed, I slammed a pencil’s eraser into the key, and always measured the key press as the second frame after contact. (The first frame was usually when the eraser barely touched the key. It would usually clear the activation depth by the second frame.)
I considered the latency to end when pixels just started to change on the screen. In practice, pixels take several 240 Hz frames to transition from black to white, but I consistently marked the beginning of that transition.
I took five measurements for each configuration and picked the median. Each measurement was relatively consistent, so average would have been a fine metric too. It doesn’t change the results below.
80x50
80x50 window, upper left of screen, cleared terminal, single keypress.
Confirmed window size with:
$ echo $(tput cols)x$(tput lines)
80x50
Terminal Median Latency (ms) 240 Hz Camera Frames conhost.exe WSL1 33.3 8 MinTTY WSL1 33.3 8 conhost.exe Cygwin 41.3 10 MinTTY Cygwin 57.9 14 WezTerm cmd.exe 62.5 15 Alacritty WSL1 62.5 15 WezTerm WSL1 66.7 16 Windows Terminal WSL1 66.7 16 Fullscreen
Maximized emacs, editing a command in the bottom row of the terminal. I only tested WSL1 this time.
Terminal Median Latency (ms) 240 Hz Camera Frames conhost.exe 45.8 11 MinTTY 52.42 12 WezTerm 75 18 Windows Terminal 75 18 Alacritty 87.5 21 Throughput
I generated a 100,000-line file with:
$ yes "This sentence has forty-five (45) characters." | head -n 100000 > /tmp/lines.txtThen I measured the wall-clock duration of:
$ time cat /tmp/lines.txtThis benchmark captures the case that I accidentally dump a ton of output and I’m sitting there just waiting for the terminal to become responsive again. I have a gigabit internet connection, and it’s embarrassing to be CPU-bound instead of IO-bound.
I did include Cygwin in this test, just to have two different MinTTY datapoints.
Terminal Elapsed Time (s) MinTTY WSL1 0.57 MinTTY Cygwin 2.2 Windows Terminal 5.25 Alacritty 5.75 WezTerm 6.2 conhost.exe 21.8 I assume this means MinTTY throttles display updates in some way. Of course this is totally fine, because you couldn’t read the output either way.
To test the hypothesis that MinTTY was caching cell rendering by their contents, I also tried generating a file that rotated through different lines, with no effect.
with open("/tmp/lines2.txt", "w") as f:
  for i in range(100000):
    sentence="This sentence has forty-five (45) characters."
    print(sentence[i%len(sentence):]+sentence[:i%len(sentence)], file=f)
CPU Usage During Repeated Keypresses
While making these measurements, I noticed some strange behaviors. My monitor runs at 120 Hz and animation and window dragging are generally smooth. But right after you start Alacritty, dragging the window animates at something like 30-60 frames per second. It’s noticeably chunkier. WezTerm does the same, but slightly worse. Maybe 20 frames per second.
I don’t know if I can blame the terminals themselves, because I sometimes experience this even with Notepad.exe too. But the choppiness stands out much more. Maybe something is CPU-bound in responding to window events?
This made me think of a new test: if I open a terminal and hold down the “a” button on autorepeat, how much CPU does the terminal consume?
To measure this, I set the terminal process’s affinity to my third physical core, and watched the CPU usage graph in Task Manager. Not a great methodology, but it gave a rough sense. Again, 80x50.
Terminal Percent of Core Private Bytes After Startup (KiB) conhost 0% 6,500 Alacritty 5% 74,000 MinTTY WSL1 10% 10,200 MinTTY Cygwin 10% 10,500 Windows Terminal 20% 73,700 WezTerm 85% 134,000 The WezTerm CPU usage has to be a bug. I’ll report it.
CPU Usage (Idle)
I often have a pile of idle terminals sitting around. I don’t want them to chew battery life. So let’s take a look at CPU Cycles Delta (courtesy of Process Explorer) with a fresh, idle WSL session.
Terminal Idle Cycles/s (Focused) Idle Cycles/s (Background) conhost ~900,000 0 Alacritty ~2,400,000 no difference WezTerm ~2,600,000 ~1,600,000 Windows Terminal ~55,000,000 ~6,100,000 MinTTY WSL1 ~120,000,000 no difference MinTTY Cygwin ~120,000,000 no difference These numbers aren’t great at all! For perspective, I have a pile of Firefox tabs open, some of them actively running JavaScript, and they’re “only” using a few hundred million cycles per second.
Raymond Chen once wrote a blog post about the importance of properly idling in the Windows Terminal Server days. You might have a dozen users logged into a host, and if a program is actively polling, it’s eating performance that others could use.
Today, we often run on batteries, so idling correctly still matters, but it seems to be something of a lost art. The only terminal that idles completely is the old conhost.exe.
The other lesson we can draw is that Microsoft’s own replacement for conhost.exe, Windows Terminal, uses over 10x the RAM, 60x the CPU when focused, and infinitely more CPU when idle.
Conclusions
conhost.exe consistently has the best latency, with MinTTY not much behind. MinTTY handily dominates the throughput test, supports all major ANSI character attributes, and has a better default palette.
As in 2009, I’d say MinTTY is still pretty great. (I should try to track down that idle CPU consumption. It feels more like a bug than a requirement.)
If you want to use MinTTY as the default terminal for WSL, install WSLtty.
The others all have slightly worse latencies, but they’re in a similar class. I’m particularly sensitive to latency, so I’d had a suspicion even before measuring. Maybe it’s some consequence of being GPU-accelerated? Out of curiousity, I put Windows Terminal in software-rendered mode, and it shaved perhaps 4 ms off (median of 62.5 ms, 15 frames). Perhaps just measurement noise.
While I’m going to stick with MinTTY, one thing is clear: there is room to improve all of the above.
-
My Minimal tmux Config
If you spend any significant time in a terminal, you’ve probably used tmux.
I’m writing this post for a few reasons:
- People have asked for my config.
- I see too many people wasting their time in the morning, rebuilding their session from the previous day.
- I felt I should justify the configuration to myself rather than setting options ad-hoc.
tmux is often paired with a persistent connection. There are two popular choices: Eternal Terminal and Mosh. The goal is to close your laptop at the end of the day, open it the next morning, and have everything where it was so you can immediately get back into flow.
Note: There are other options. WezTerm has built-in multiplexing, for example.
macOS + iTerm2 + Eternal Terminal + tmux Control Mode
If you use macOS, iTerm2 has deep tmux integration in the form of tmux Control Mode.
tmux windows map to iTerm2 tabs. Native tab navigation and scrollback (both scrolling and find) work just as you’d expect.
tmux control mode does expect a reliable stream channel, so if you want a connection that persists even when network connections are dropped, Mosh will not work. You’ll need Eternal Terminal.
If you use a Mac, this is an excellent configuration. I worked on EdenFS and Watchman for almost five years this way.
mosh + tmux
But now I use Windows and Linux and can’t use iTerm2, so tmux within Mosh it is.
I find tmux’s default keybindings a little awkward, and the colors simultaneously harsh and too minimal, so I made a configuration to match my tastes.
You can download the full .tmux.conf here.
(You can go crazy, but avoiding too much fanciness was my goal. If you want all the bling, install the Tmux Plugin Manager and things like tmux-powerline.
.tmux.conf
First, a small demonstration.
Despite all of the work I put into my recent post about 24-bit color in terminals, I do still use some with limited color support. macOS’s Terminal.app only supports the 256-color palette, and the Linux console only really supports 8. The following selects the correct
tmuxterminfo entry.# Detect the correct TERM value for new sessions. # if-shell uses /bin/sh, so bashisms like [[ do not work. if "[ $(tput colors) = 16777216 ]" { set -g default-terminal "tmux-direct" } { if "[ $(tput colors) = 256 ]" { set -g default-terminal "tmux-256color" } { set -g default-terminal "tmux" } }I prefer Emacs keybindings in both bash (readline) and tmux.
setw -g mode-keys emacsThe next setting is more legacy terminal insanity. On some (most?) terminals, programs cannot differentiate between a user pressing the escape key and the beginning of an escape sequence.
readlineandtmuxdefault to 500 ms, which adds noticeable latency in some terminals when using programs likevi.There’s no correct value here. Ideally, your terminal would use an unambiguous code for the escape key, like MinTTY.
set -s escape-time 200Let’s not be stingy with scrollback! Searching lots of history is worth spending megabytes.
# I can afford 50 MB of scrollback.
# Measured on WSL 1 with:
# yes $(python3 -c "print('y' * 80)")
set -g history-limit 100000
By default, if multiple clients connect to one tmux session, tmux will resize all of the windows to the smallest connected terminal.
This behavior is annoying, and it’s always an accident. Sometimes I’ll leave a temporary connection to a server from home and then another fullscreen connection from work will cram each window into 80x25.
The
aggressive-resizeoption applies this logic only to the currently-viewed window, not everything in the session.setw -g aggressive-resize onWindow titles don’t automatically forward to the whatever graphical terminal you’re using. Do that, and add the hostname, but keep it concise.
set -g set-titles on
set -g set-titles-string "#h: #W"
iTerm2 has this nice behavior where active tabs are visually marked so you can see, at a glance, which had recent activity. The following two options offer similar behavior. Setting
activity-actiontononedisables any audible ding or visible flash, leaving just a subtle indication in the status bar.set -g monitor-activity on set -g activity-action noneThe following is perhaps the most important part of my configuration: tab management. Like browsers and iTerm2, I want my tabs numbered. I want a single (modified) keypress to select a tab, and I want tabs automatically renumbered as they’re created, destroyed, and reordered.
I also want iTerm2-style previous- and next-tab keybindings.
# Match window numbers to the order of the keys on a keyboard.
set -g base-index 1
setw -g pane-base-index 1

setw -g renumber-windows on

# My tmux muscle memory still wants C-b 0 to select the first window.
bind 0 select-window -t ":^"
# Other terminals and web browsers use 9 to focus the final tab.
bind 9 select-window -t ":$"

bind -n "M-0" select-window -t ":^"
bind -n "M-1" select-window -t ":1"
bind -n "M-2" select-window -t ":2"
bind -n "M-3" select-window -t ":3"
bind -n "M-4" select-window -t ":4"
bind -n "M-5" select-window -t ":5"
bind -n "M-6" select-window -t ":6"
bind -n "M-7" select-window -t ":7"
bind -n "M-8" select-window -t ":8"
# Browsers also select last tab with M-9.
bind -n "M-9" select-window -t ":$"
# Match iTerm2.
bind -n "M-{" previous-window
bind -n "M-}" next-window
Note that Emacs assigns meaning to Alt-number. If it matters to you, pick a different modifier.
Now let’s optimize the window ordering. By default,
C-b ccreates a new window at the end. That’s a fine default. But sometimes I want a new window right after the current one, so defineC-b C-c. Also, add some key bindings for sliding the current window around.bind "C-c" new-window -a bind "S-Left" { swap-window -t -1 select-window -t -1 } bind "S-Right" { swap-window -t +1 select-window -t +1 }I wanted “C-{“ and “C-}” but terminal key encoding doesn’t work like that.
Next, let’s define some additional key bindings for very common operations.
By default, searching in the scrollback requires entering “copy mode” with
C-b [and then entering reverse search mode withC-r. Searching is common, so give it a dedicatedC-b r.bind r { copy-mode command-prompt -i -p "(search up)" \ "send-keys -X search-backward-incremental '%%%'" }And some convenient toggles:
# Toggle terminal mouse support.
bind m set-option -g mouse \; display "Mouse: #{?mouse,ON,OFF}"

# Toggle status bar. Useful for fullscreen focus.
bind t set-option status
Now the status bar. The default status bar is okay, but we can do better.
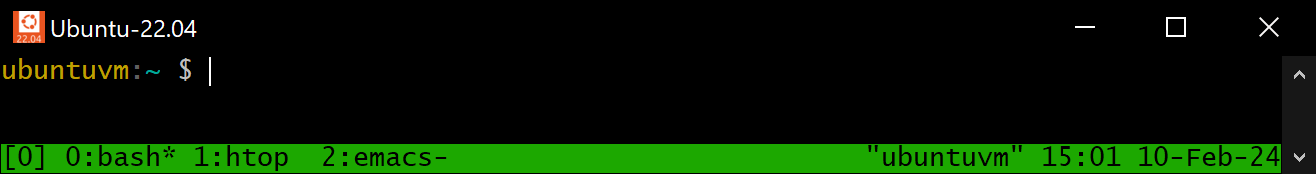
tmux status bar: before - Move the tmux session ID next to the hostname on the right side.
- Move the current time to the far right corner.
- Keep the date, but I think I can remember what year it is.
- Ensure there is a single space between the windows and the left edge. Without a space at the edge, it looks weird.
tmux status bar: after The other half of that improvement is the color scheme. Instead of a harsh black-on-green, I chose a scheme that evokes old amber CRT phosphors or gas plasma displays My dad had a “laptop” with one of those when I was young.
The following color scheme mildly highlights the current window and uses a dark blue for the hostname-and-time section. These colors don’t distract me when I’m not working, but if I do look, the important information is there.
if "[ $(tput colors) -ge 256 ]" {
  set -g status-left-style "fg=black bg=colour130"
  set -g status-right-style "bg=colour17 fg=orange"
  set -g status-style "fg=black bg=colour130"
  set -g message-style "fg=black bg=colour172"
  # Current window should be slightly brighter.
  set -g window-status-current-style "fg=black bg=colour172"
  # Windows with activity should be very subtly highlighted.
  set -g window-status-activity-style "fg=colour17 bg=colour130"
  set -g mode-style "fg=black bg=colour172"
}
And that’s it!
Again, feel free to copy the complete .tmux.conf.
Shell Integration
There’s one more config to mention: adding some shell aliases to .bashrc.
I sometimes want to look at or edit a file right next to my shell.
if [[ "$TMUX" ]]; then
    function lv() {
        tmux split-window -h less "$@"
    }
    function ev() {
        tmux split-window -h emacs "$@"
    }
    function lh() {
        tmux split-window -v less "$@"
    }
    function eh() {
        tmux split-window -v emacs "$@"
    }
fi
(You may notice the aliases use different meanings of horizontal and vertical than tmux. I don’t know, it feels like tmux is backwards, but that could be my brain.)
Happy multiplexing!
-
I Just Wanted Emacs to Look Nice — Using 24-Bit Color in Terminals
Thanks to some coworkers and David Wilson’s Emacs from Scratch playlist, I’ve been getting back into Emacs. The community is more vibrant than the last time I looked, and LSP brings modern completion and inline type checking.
David’s Emacs looks so fancy — I want nice colors and fonts too, especially my preferred themes like Solarized.
From desktop environments, Emacs automatically supports 24-bit color.
Graphical Emacs: Fonts and Colors But, since I work on infrastructure, I’ve lived primarily in terminals for years. And my Emacs looks like:
Terminal Emacs: Not Fancy It turns out, for years, popular terminals have supported 24-bit color. And yet they’re rarely used.
Like everything else, it boil down to legacy and politics. Control codes are a protocol, and changes to that protocol take time to propagate, especially with missteps along the way.
This post is two things:
- how to enable true-color support in the terminal environments I use, and
- how my desire for nice colors in Emacs led to poring over technical standards from the 70s, 80s, and 90s, wondering how we got to this point.
NOTE: I did my best, but please forgive any terminology slip-ups or false histories. I grew up on VGA text mode UIs, but never used a hardware terminal and wasn’t introduced to unix until much later.
ANSI Escape Codes
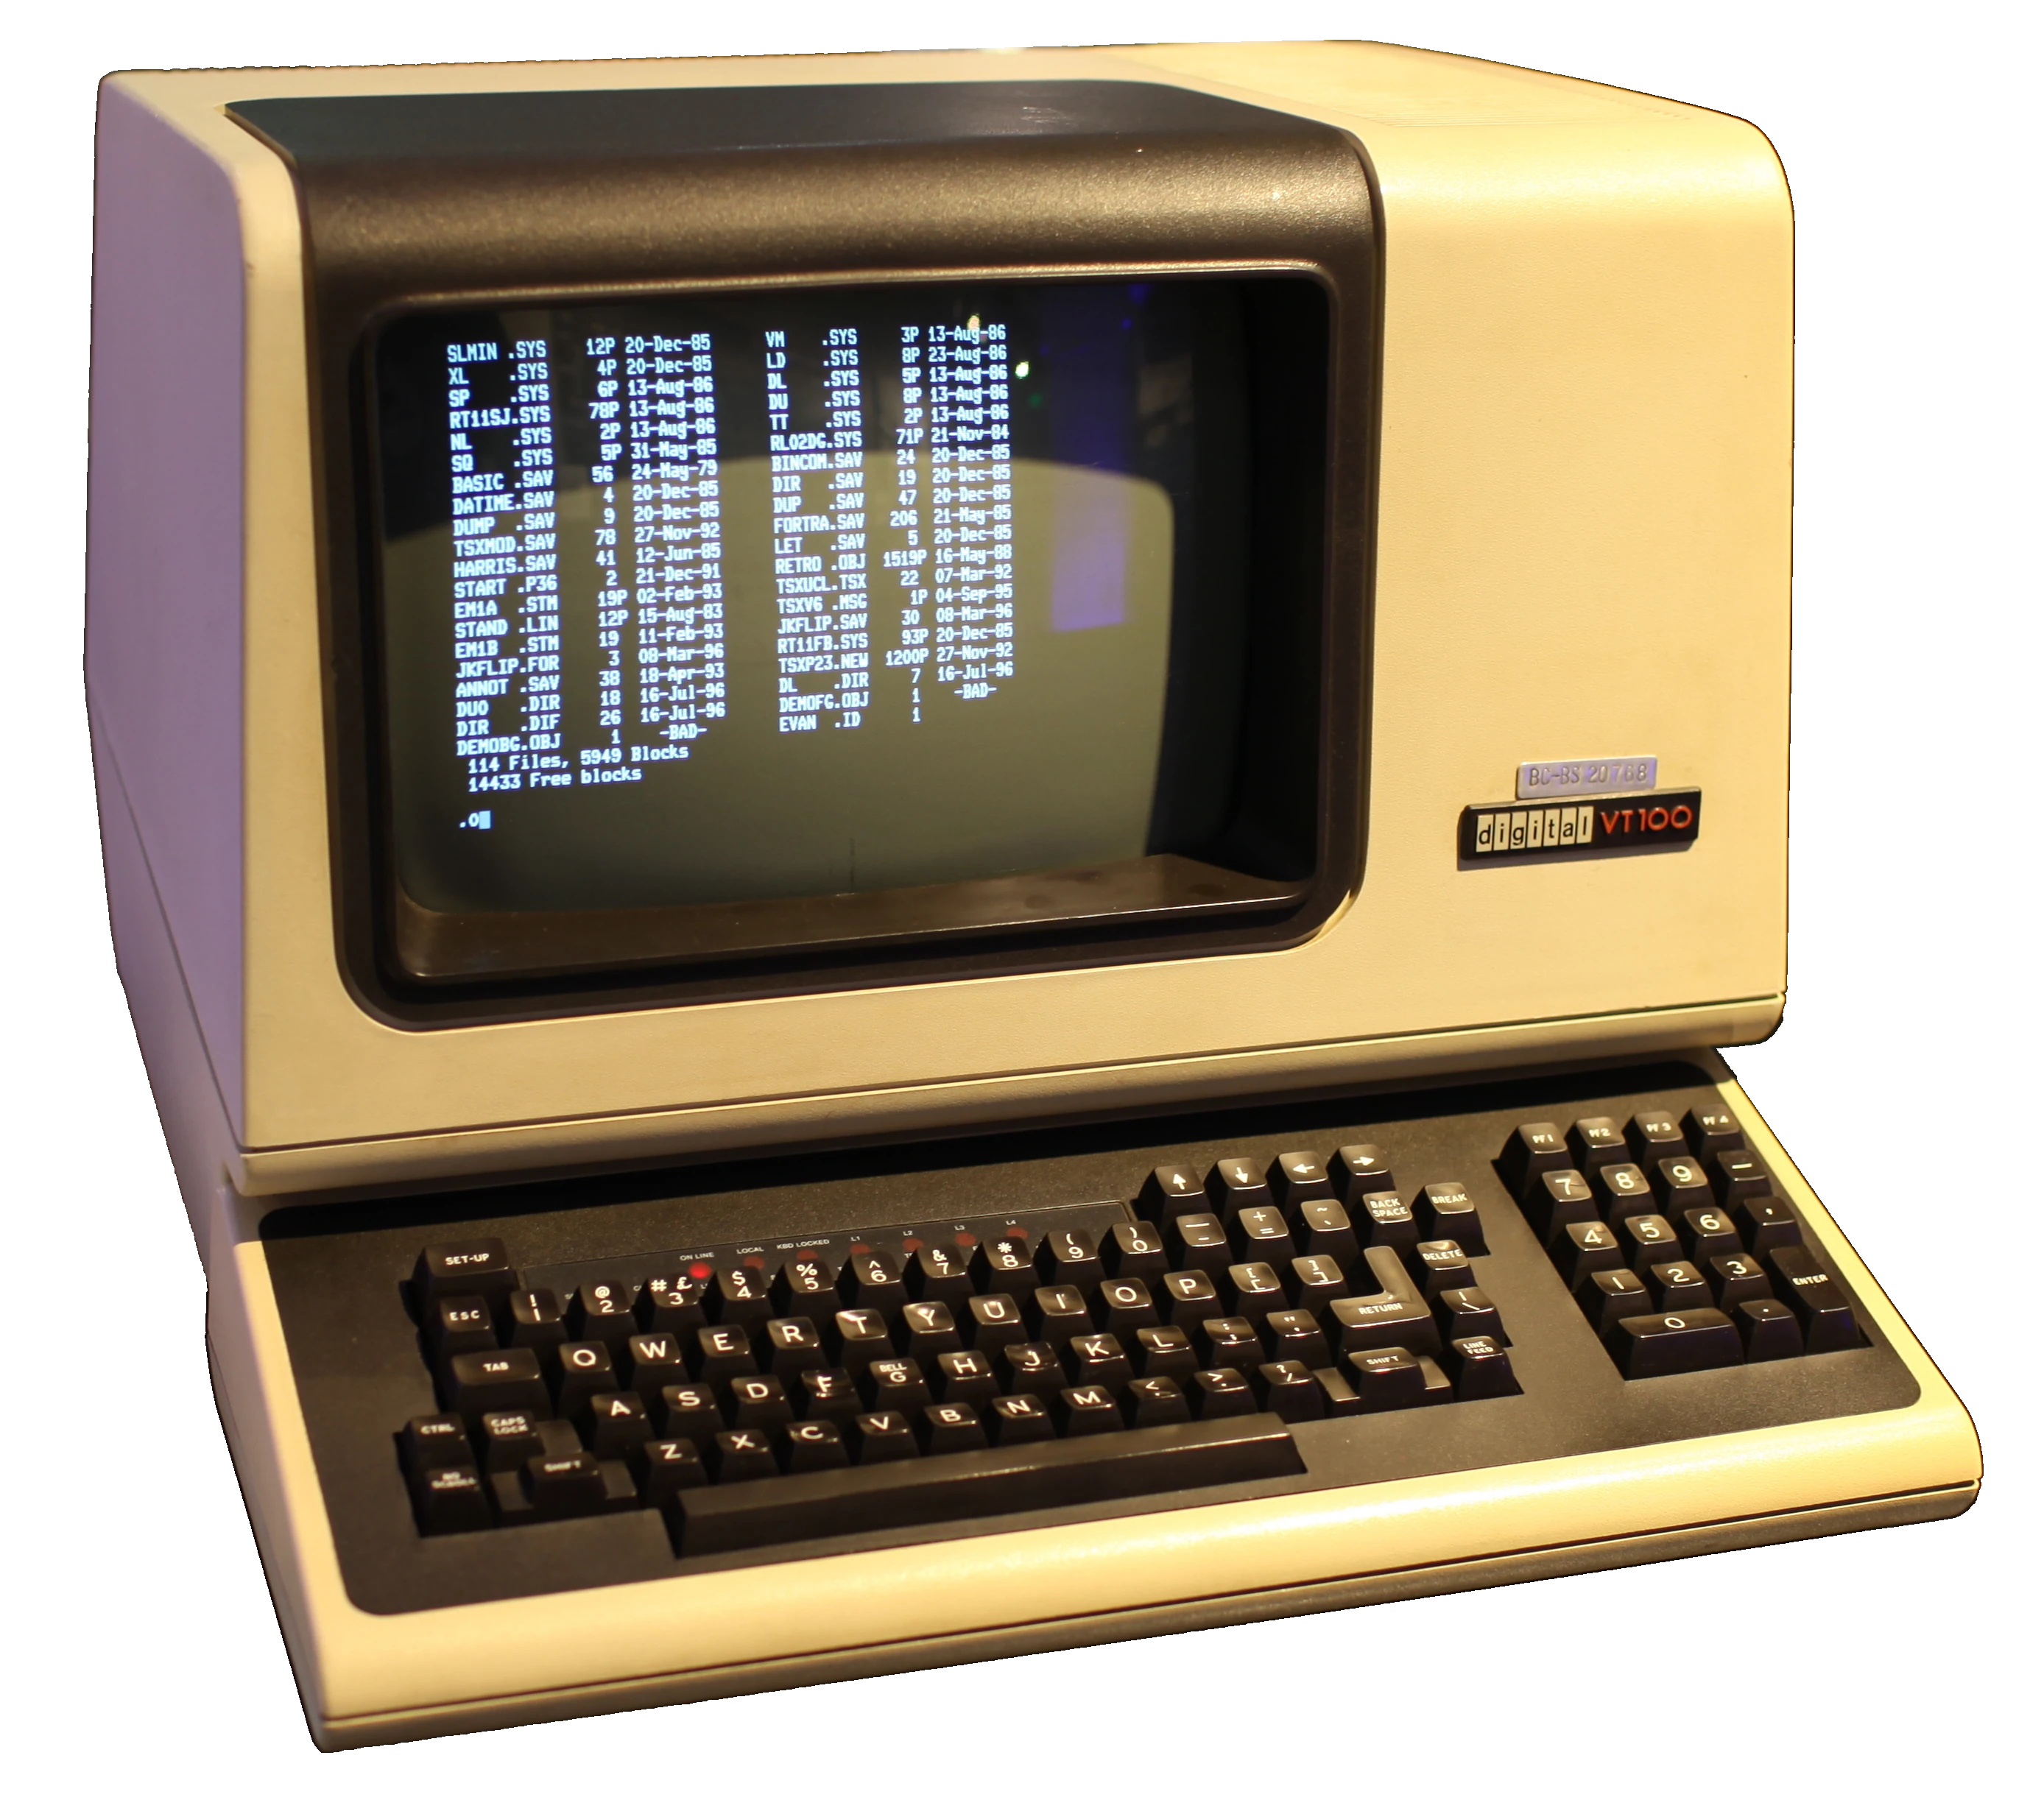
Early hardware terminals offered their own, incompatible, control code schemes. That made writing portable software hard, so ANSI standardized the protocol, while reserving room for expansion and vendor-specific capabilities.
DEC VT100 (1978) ANSI escape codes date back to the 70s. They cover a huge range of functionality, but since this post is focused on colors, I’m mostly interested in SGR (Select Graphics Rendition), which allows configuring a variety of character display attributes:
- bold or intensity
- italics (not frequently supported)
- blink
- foreground and background colors
- and a bunch of other stuff. You can look at Wikipedia.
3-, 4-, and 8-bit Color
When color was introduced, there were eight. Black, white, the additive primaries, and the subtractive primaries. The eight corners of an RGB color cube.
Later, a bright (or bold) bit added eight more; “bright black” being dark gray.

4-Bit VGA Text Mode Palette In 1999, Todd Larason patched xterm to add support for 256 colors. He chose a palette that filled out the RGB color cube with a 6x6x6 interior sampling and added a 24-entry finer-precision grayscale ramp.
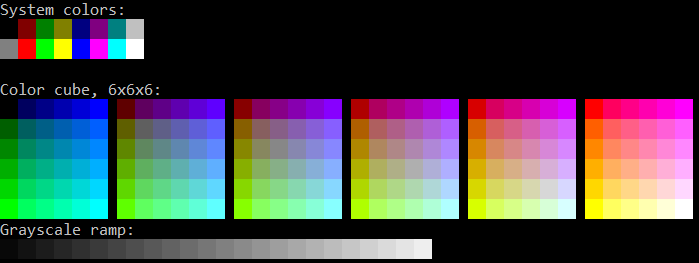
Output From colortest-256 NOTE: There’s a rare, but still-supported, 88-color variant with a 4x4x4 color cube and 8-entry grayscale ramp, primarily to reduce the use of historically-limited X11 color objects.
NOTE: We’ll debug this later, but Todd’s patch to add 256-color support to xterm used semicolons as the separator between the ANSI SGR command 48 and the color index, which set off a chain reaction of ambiguity we’re still dealing with today.
Where Did 24-Bit Color Support Come From?
It’s well-documented how to send 8-bit and 24-bit colors to compatible terminals. Per Wikipedia:
ESC[38;5;<n>msets foreground colornper the palettes above.ESC[38;2;<r>;<g>;<b>msets foreground color (r,g,b).(Again, that confusion about semicolons vs. colons, and an unused colorspace ID if colons are used. We’ll get to the bottom of that soon.)
But why 5? Why 2? How did any of this come about? I’d struggled enough with unexpected output that it was time to discover the ground truth.
Finding and reading original sources led me to construct the following narrative:
- In the 70s, ANSI standardized terminal escape sequences, resulting in ANSI X3.64 and the better-known ECMA-48.
- The first edition of ECMA-48 is lost to time, but it probably looks much like ANSI X3.64.
- The 2nd
edition
of ECMA-48 (1979) allocated SGR parameters 30-37 and 40-47 for setting
3-bit foreground and background colors, respectively.
- By the way, these standards use the word “parameter” to mean command, and “subparameter” to mean argument, if applicable.
- The 3rd edition (1984) introduced the concept of an implementation-defined default color for both foreground and background, and allocated parameters 39 and 49, respectively.
- Somewhere in this timeline, vendors did ship hardware terminals with richer color support. The Wyse WY-370 introduced new color modes, including a direct-indexed 64-color palette. (See Page 86 of its Programmer’s Guide.)
- 38 and 48 are the most important parameters for selecting colors
today, but they weren’t allocated by either the
4th
(1986) or
5th
(1991) editions. So where did they come from? The 5th edition gives
a clue:
reserved for future standardization; intended for setting character foreground colour as specified in ISO 8613-6 [CCITT Recommendation T.416]
-
ISO 8613 was a boondoggle of a project intended to standardize and replace all proprietary document file formats. You’ve never heard of it, so it obviously failed. But its legacy lives on – ISO 8613-6 (ITU T.416) (1993) built on ECMA-48’s codes and defined parameters 38 and 48 as extended foreground and background color modes, respectively.
The first parameter element indicates a choice between:
- 0 implementation defined (only applicable for the character foreground colour)
- 1 transparent;
- 2 direct colour in RGB space;
- 3 direct colour in CMY space;
- 4 direct colour in CMYK space;
- 5 indexed colour.
There we go! That is why 5 is used for 256-color mode and 2 is 24-bit RGB.
Careful reading also gives a clue as to the semicolon vs. colon syntax screw-up. Note the subtle use of the term “parameter element” vs. “parameter”.
If you read ISO 8613-6 (ITU T.416) and ECMA-48 closely, it’s not explicitly stated, but they seem to indicate that unknown parameters for commands like “select graphics rendition” should be ignored. And parameters are separated with semicolons.
That implies
ESC[38;5;3mshould be interpreted, in terminals that don’t support SGR 38, as “unknown, ignored (38)”, “blinking (5)”, and “italicized (3)”. The syntax should use colons to separate sub-parameter components, but something got lost along the way.(Now, in practice, programs are told how to communicate with their terminals via the TERM variable and the terminfo database, so I don’t know how much pain occurs in reality.)
Thomas Dickey has done a great job documenting the history of ncurses and xterm, and, lo and behold, explains exactly the origin of the ambiguous syntax:
We used semicolon (like other SGR parameters) for separating the R/G/B values in the escape sequence, since a copy of ITU T.416 (ISO-8613-6) which presumably clarified the use of colon for this feature was costly.
Using semicolon was incorrect because some applications could expect their parameters to be order-independent. As used for the R/G/B values, that was order-dependent. The relevant information, by the way, is part of ECMA-48 (not ITU T.416, as mentioned in Why only 16 (or 256) colors?). Quoting from section 5.4.2 of ECMA-48, page 12, and adding emphasis (not in the standard):
Each parameter sub-string consists of one or more bit combinations from 03/00 to 03/10; the bit combinations from 03/00 to 03/09 represent the digits ZERO to NINE; bit combination 03/10 may be used as a separator in a parameter sub-string, for example, to separate the fractional part of a decimal number from the integer part of that number.
and later on page 78, in 8.3.117 SGR – SELECT GRAPHIC RENDITION, the description of SGR 38:
(reserved for future standardization; intended for setting character foreground colour as specified in ISO 8613-6 [CCITT Recommendation T.416])
Of course you will immediately recognize that 03/10 is ASCII colon, and that ISO 8613-6 necessarily refers to the encoding in a parameter sub-string. Or perhaps you will not.
So it’s all because the ANSI and ISO standards are ridiculously expensive (to this day, these crappy PDF scans from the 90s and earlier are $200 USD!) and because they use a baroque syntax to denote ASCII characters. While writing this post, I had to keep
man asciiopen to match, for example,03/10to colon and03/11to semicolon. I guess it’s how standards were written back then. A Hacker News thread in the context of WezTerm gives more detail.So, to recap in the timeline:
- 1999: Thomas Dickey merged Todd Larason’s 256-color patches with ambiguous semicolon syntax.
- 2006: Konsole added support for 256-color and 24-bit truecolor using the same ambiguous syntax as xterm, with a follow-on discussion about colons vs. semicolons. The issue was noticed, but semicolon syntax was adopted anyway.
- 2012: Thomas Dickey fixed xterm to accept the standards-compliant syntax.
- 2016: Windows 10’s built-in console gained ANSI escape code support, including 24-bit colors. Unfortunately with the ambiguous semicolon syntax.
- 2019: Windows Terminal is released, with ANSI escape code support, but also using ambiguous semicolon syntax.
- 2022: Microsoft announced ecosystem-wide migration from the legacy framebuffer-based VGA-style console subsystem to ANSI terminal emulation, specifically using xterm as a guide.
- 2022: Konsole gains support for standards-compliant syntax.
Okay, here’s what we’ve established:
- ANSI codes are widely supported, even on Windows.
- Truecolor support is either widely supported or (for example, on the Linux text mode terminal) at least recognized and mapped to a more limited palette.
- Semicolon syntax is the most compatible, though the unambiguous colon syntax is slowly spreading.
I wrote a small colortest.rs program to test color support and attributes like reverse and italics to confirm the above in every terminal I use.
Terminfo
Now that we’ve established terminal capabilities and how to use them, the next trick is to convince software of varying lineages to detect and use the best color support available.
Typically, this is done with the old terminfo library (or the even older termcap).
Terminfo provides a database of terminal capabilities and the ability to generate appropriate escape sequences. The TERM environment variable tells programs which terminfo record to use. Its value is automatically forwarded over
sshconnections.Terminfo uses ridiculous command names:
infocmp,tic,toe. (Not to be confused with the unrelatedtac.)To see the list of terminfo records installed on your host, run
toe
-a
. (Do we /really/ need to install support for every legacy hardware terminal on modern machines? Good luck even finding a hardware terminal these days. They’re collector’s items.)infocmpis how you inspect the capabilities of a specific terminfo record.$ infocmp xterm-256color # Reconstructed via infocmp from file: /lib/terminfo/x/xterm-256color xterm-256color|xterm with 256 colors, am, bce, ccc, km, mc5i, mir, msgr, npc, xenl, colors#0x100, cols#80, it#8, lines#24, pairs#0x10000, acsc=``aaffggiijjkkllmmnnooppqqrrssttuuvvwwxxyyzz{{||}}~~, bel=^G, blink=\E[5m, bold=\E[1m, cbt=\E[Z, civis=\E[?25l, clear=\E[H\E[2J, cnorm=\E[?12l\E[?25h, cr=\r, csr=\E[%i%p1%d;%p2%dr, cub=\E[%p1%dD, cub1=^H, cud=\E[%p1%dB, cud1=\n, cuf=\E[%p1%dC, cuf1=\E[C, cup=\E[%i%p1%d;%p2%dH, cuu=\E[%p1%dA, cuu1=\E[A, cvvis=\E[?12;25h, dch=\E[%p1%dP, dch1=\E[P, dim=\E[2m, dl=\E[%p1%dM, dl1=\E[M, ech=\E[%p1%dX, ed=\E[J, el=\E[K, el1=\E[1K, flash=\E[?5h$<100/>\E[?5l, home=\E[H, hpa=\E[%i%p1%dG, ht=^I, hts=\EH, ich=\E[%p1%d@, il=\E[%p1%dL, il1=\E[L, ind=\n, indn=\E[%p1%dS, initc=\E]4;%p1%d;rgb:%p2%{255}%*%{1000}%/%2.2X/%p3%{255}%*%{1000}%/%2.2X/%p4%{255}%*%{1000}%/%2.2X\E\\, invis=\E[8m, is2=\E[!p\E[?3;4l\E[4l\E>, kDC=\E[3;2~, kEND=\E[1;2F, kHOM=\E[1;2H, kIC=\E[2;2~, kLFT=\E[1;2D, kNXT=\E[6;2~, kPRV=\E[5;2~, kRIT=\E[1;2C, ka1=\EOw, ka3=\EOy, kb2=\EOu, kbeg=\EOE, kbs=^?, kc1=\EOq, kc3=\EOs, kcbt=\E[Z, kcub1=\EOD, kcud1=\EOB, kcuf1=\EOC, kcuu1=\EOA, kdch1=\E[3~, kend=\EOF, kent=\EOM, kf1=\EOP, kf10=\E[21~, kf11=\E[23~, kf12=\E[24~, kf13=\E[1;2P, kf14=\E[1;2Q, kf15=\E[1;2R, kf16=\E[1;2S, kf17=\E[15;2~, kf18=\E[17;2~, kf19=\E[18;2~, kf2=\EOQ, kf20=\E[19;2~, kf21=\E[20;2~, kf22=\E[21;2~, kf23=\E[23;2~, kf24=\E[24;2~, kf25=\E[1;5P, kf26=\E[1;5Q, kf27=\E[1;5R, kf28=\E[1;5S, kf29=\E[15;5~, kf3=\EOR, kf30=\E[17;5~, kf31=\E[18;5~, kf32=\E[19;5~, kf33=\E[20;5~, kf34=\E[21;5~, kf35=\E[23;5~, kf36=\E[24;5~, kf37=\E[1;6P, kf38=\E[1;6Q, kf39=\E[1;6R, kf4=\EOS, kf40=\E[1;6S, kf41=\E[15;6~, kf42=\E[17;6~, kf43=\E[18;6~, kf44=\E[19;6~, kf45=\E[20;6~, kf46=\E[21;6~, kf47=\E[23;6~, kf48=\E[24;6~, kf49=\E[1;3P, kf5=\E[15~, kf50=\E[1;3Q, kf51=\E[1;3R, kf52=\E[1;3S, kf53=\E[15;3~, kf54=\E[17;3~, kf55=\E[18;3~, kf56=\E[19;3~, kf57=\E[20;3~, kf58=\E[21;3~, kf59=\E[23;3~, kf6=\E[17~, kf60=\E[24;3~, kf61=\E[1;4P, kf62=\E[1;4Q, kf63=\E[1;4R, kf7=\E[18~, kf8=\E[19~, kf9=\E[20~, khome=\EOH, kich1=\E[2~, kind=\E[1;2B, kmous=\E[<, knp=\E[6~, kpp=\E[5~, kri=\E[1;2A, mc0=\E[i, mc4=\E[4i, mc5=\E[5i, meml=\El, memu=\Em, mgc=\E[?69l, nel=\EE, oc=\E]104\007, op=\E[39;49m, rc=\E8, rep=%p1%c\E[%p2%{1}%-%db, rev=\E[7m, ri=\EM, rin=\E[%p1%dT, ritm=\E[23m, rmacs=\E(B, rmam=\E[?7l, rmcup=\E[?1049l\E[23;0;0t, rmir=\E[4l, rmkx=\E[?1l\E>, rmm=\E[?1034l, rmso=\E[27m, rmul=\E[24m, rs1=\Ec\E]104\007, rs2=\E[!p\E[?3;4l\E[4l\E>, sc=\E7, setab=\E[%?%p1%{8}%<%t4%p1%d%e%p1%{16}%<%t10%p1%{8}%-%d%e48;5;%p1%d%;m, setaf=\E[%?%p1%{8}%<%t3%p1%d%e%p1%{16}%<%t9%p1%{8}%-%d%e38;5;%p1%d%;m, sgr=%?%p9%t\E(0%e\E(B%;\E[0%?%p6%t;1%;%?%p5%t;2%;%?%p2%t;4%;%?%p1%p3%|%t;7%;%?%p4%t;5%;%?%p7%t;8%;m, sgr0=\E(B\E[m, sitm=\E[3m, smacs=\E(0, smam=\E[?7h, smcup=\E[?1049h\E[22;0;0t, smglp=\E[?69h\E[%i%p1%ds, smglr=\E[?69h\E[%i%p1%d;%p2%ds, smgrp=\E[?69h\E[%i;%p1%ds, smir=\E[4h, smkx=\E[?1h\E=, smm=\E[?1034h, smso=\E[7m, smul=\E[4m, tbc=\E[3g, u6=\E[%i%d;%dR, u7=\E[6n, u8=\E[?%[;0123456789]c, u9=\E[c, vpa=\E[%i%p1%dd,There’s so much junk in there. I wonder how much only applies to non-ANSI hardware terminals, and therefore is irrelevant these days.
For now, we’re only interested in three of these capabilities:
colorsis how many colors this terminal supports. The standard values are 0, 8, 16, 256, and 0x1000000 (24-bit), though other values exist.setafandsetabset foreground and background colors, respectively. I believe they stand for “Set ANSI Foreground” and “Set ANSI Background”. Each takes a single argument, the color number.
Those percent signs are a parameter arithmetic and substitution language. Let’s decode
setafin particular:setaf=\E[%?%p1%{8}%<%t3%p1%d%e%p1%{16}%<%t9%p1%{8}%-%d%e38;5;%p1%d%;mprint "\E[" if p1 < 8 { print "3" p1 } else if p1 < 16 { print "9" (p1 - 8) } else { print "38;5;" p1 } print "m"This is the
xterm-256colorterminfo description. It only knows how to output the ANSI 30-37 SGR parameters, the non-standard 90-97 brights (from IBM AIX), or otherwise the 256-entry palette, using ambiguous semicolon-delimited syntax.Let’s compare with
xterm-direct, the terminfo entry that supports RGB.$ infocmp xterm-256color xterm-direct comparing xterm-256color to xterm-direct. comparing booleans. ccc: T:F. comparing numbers. colors: 256, 16777216. comparing strings. initc: '\E]4;%p1%d;rgb:%p2%{255}%*%{1000}%/%2.2X/%p3%{255}%*%{1000}%/%2.2X/%p4%{255}%*%{1000}%/%2.2X\E\\', NULL. oc: '\E]104\007', NULL. rs1: '\Ec\E]104\007', '\Ec'. setab: '\E[%?%p1%{8}%<%t4%p1%d%e%p1%{16}%<%t10%p1%{8}%-%d%e48;5;%p1%d%;m', '\E[%?%p1%{8}%<%t4%p1%d%e48:2::%p1%{65536}%/%d:%p1%{256}%/%{255}%&%d:%p1%{255}%&%d%;m'. setaf: '\E[%?%p1%{8}%<%t3%p1%d%e%p1%{16}%<%t9%p1%{8}%-%d%e38;5;%p1%d%;m', '\E[%?%p1%{8}%<%t3%p1%d%e38:2::%p1%{65536}%/%d:%p1%{256}%/%{255}%&%d:%p1%{255}%&%d%;m'.A few things are notable:
xterm-directadvertises 16.7 million colors, as expected.xterm-directunsets thecccboolean, which indicates color indices cannot have new RGB values assigned.- Correspondingly, xterm-direct unsets
initc,oc, andrs1, also related to changing color values at runtime. - And of course
setafandsetabchange. We’ll decode that next.
Here’s where Terminfo’s limitations cause us trouble. Terminfo and ncurses are tied at the hip. Their programming model is that there are N palette entries, each of which has a default RGB value, and terminals may support overriding any palette entry’s RGB value.
The
-directterminals, however, are different. They represent 24-bit colors by pretending there are 16.7 million palette entries, each of which maps to the 8:8:8 RGB cube, but whose values cannot be changed.Now let’s look at the new
setaf:print "\E[" if p1 < 8 { print "3" p1 } else { print "38:2::" (p1 / 65536) ":" ((p1 / 256) & 255) ":" (p1 & 255) } print "m"It’s not quite as simple as direct RGB. For compatibility with programs that assume the meaning of
setaf, this scheme steals the darkest 7 blues, not including black, and uses them for compatibility with the basic ANSI 8 colors. Otherwise, there’s a risk of legacy programs outputting barely-visible dark blues instead of the ANSI colors they expect.One consequence is that the
-directschemes are incompatible with the-256colorschemes, so programs must be aware that 256 colors means indexed and 16.7 million means direct, except that the darkest 7 blues are to be avoided.Fundamentally, terminfo has no notion of color space. So a program that was written before terminfo even supported more colors than 256 might (validly!) assume the values of the first 8, 16, or even 256 palette entries.
This explains an issue with the Rust crate termwiz that I recently ran into at work. A program expected to output colors in the xterm-256color palette, but was actually generating various illegibly-dark shades of blue. (Note: Despite the fact that the issue is open as of this writing, @quark-zju landed a fix, so current termwiz behaves reasonably.)
This is a terminfo restriction, not a terminal restriction. As far as I know, every terminal that supports 24-bit color also supports the xterm 256-color palette and even dynamically changing their RGB values. (You can even animate the palette like The Secret of Monkey Island did!) While I appreciate Thomas Dickey’s dedication to accurately documenting history and preserving compatibility, terminfo simply isn’t great at accurate and timely descriptions of today’s vibrant ecosystem of terminal emulators.
Kovid Goyal, author of kitty, expresses his frustration:
To summarize, one cannot have both 256 and direct color support in one terminfo file.
Frustrated users of the ncurses library have only themselves to blame, for choosing to use such a bad library.
A deeper, more accurate discussion of the challenges are documented in kitty issue #879.
In an ideal world, terminfo would have introduced a brand new capability for 24-bit RGB, leaving the adjustable 256-color palette in place.
Modern programs should probably disregard most of terminfo and assume that 16.7 million colors implies support for the rest of the color capabilities. And maybe generate their own ANSI-compatible escape sequences… except for the next wrinkle.
Setting TERM: Semicolons Again!
Gripes about terminfo aside, everyone uses it, so we do need to ensure TERM is set correctly.
While I’d like to standardize on the colon-based SGR syntax, several terminals I use only support semicolons:
- Conhost, Windows’s built-in console.
- Mintty
claims to
work
(and wsltty does), but for some
reason running my colortest.rs
program
from Cygwin only works with semicolon syntax, unless I pipe the
output through
cator a file. There must be some kind of magic translation happening under the hood. I haven’t debugged. - Mosh is aware, but hasn’t added support.
- PuTTY.
- Ubuntu 22.04 LTS ships a version of Konsole that only supports semicolons.
Terminfo entries are built from “building blocks”, marked with a plus.
xterm+directis the building block for the standard colon-delimited syntax.xterm+indirectis the building block for legacy terminals that only support semicolon syntax.Searching for
xterm+indirectshows which terminfo entries might work for me.vscode-directlooks the most accurate. I assume that, since it targets a Microsoft terminal, it’s probably close enough in functionality to Windows Terminal and Windows Console. I have not audited all capabilities, but it seems to work.The next issue was that none of my servers had the
-directterminfo entries installed! On most systems, the terminfo database comes from thencurses-basepackage, but you needncurses-termfor the extended set of terminals.At work, we can configure a default set of installed packages for your hosts, but I have to install them manually on my unmanaged personal home machines. Also, I was still running Ubuntu 18, so I had to upgrade to a version that contained the
-directterminfo entries. (Of course, two of my headless machines failed to boot after upgrading, but that’s a different story.)Unfortunately, there is no terminfo entry for the Windows console.Since I started writing this post, ncurses introduced a winconsole terminfo entry, but it neither supports 24-bit color nor is released in any ncurses version.Configuring Emacs
Emacs documents how it detects truecolor support.
I find it helpful to
M-x eval-expression(display-color-cells)to confirm whether Emacs sees 16.7 million colors.Emacs also documents the
-directmode terminfo limitation described above:Terminals with ‘RGB’ capability treat pixels #000001 - #000007 as indexed colors to maintain backward compatibility with applications that are unaware of direct color mode. Therefore the seven darkest blue shades may not be available. If this is a problem, you can always use custom terminal definition with ‘setb24’ and ‘setf24’.
It’s worth noting that
RGBis Emacs’s fallback capability. Emacs looks for thesetf24andsetb24strings first, but no terminfo entries on my machine contain those capabilities:$ for t in $(toe -a | cut -f1); do if (infocmp "$t" | grep 'setf24') > /dev/null; then echo "$t"; fi; done $Nesting Terminals
conhost.exe (WSL1)
+-------------------------+
| mosh                    |
| +---------------------+ |
| | tmux                | |
| | +-----------------+ | |
| | | emacs terminal  | | |
| | | +-------------+ | | |
| | | | $ ls        | | | |
| | | | foo bar baz | | | |
| | | +-------------+ | | |
| | +-----------------+ | |
| +---------------------+ |
+-------------------------+
I’d never consciously considered this, but my typical workflow nests multiple terminals.
- I open a graphical terminal emulator on my local desktop, Windows, Mac, or Linux.
- I mosh to a remote machine or VM.
- I start tmux.
- I might then use a terminal within Emacs or
Asciinema or GNU
Screen.
- Yes, there are situations where it’s useful to have some screen sessions running inside or outside of tmux.
Each of those layers is its own implementation of the ANSI escape sequence state machine. For 24-bit color to work, every single layer has to understand and accurately translate the escape sequences from the inner TERM value’s terminfo to the outer terminfo.
Therefore, you need recent-enough versions of all of this software. Current LTS Ubuntus only ship with mosh 1.3, so I had to enable the mosh-dev PPA.
TERM must be set correctly within each terminal:
tmux-directwithin tmux, for example. There is no standard terminfo formosh, so you have to pick something close enough.Graphical Terminal Emulators
Most terminals either set TERM to a reasonable default or allow you to override TERM.
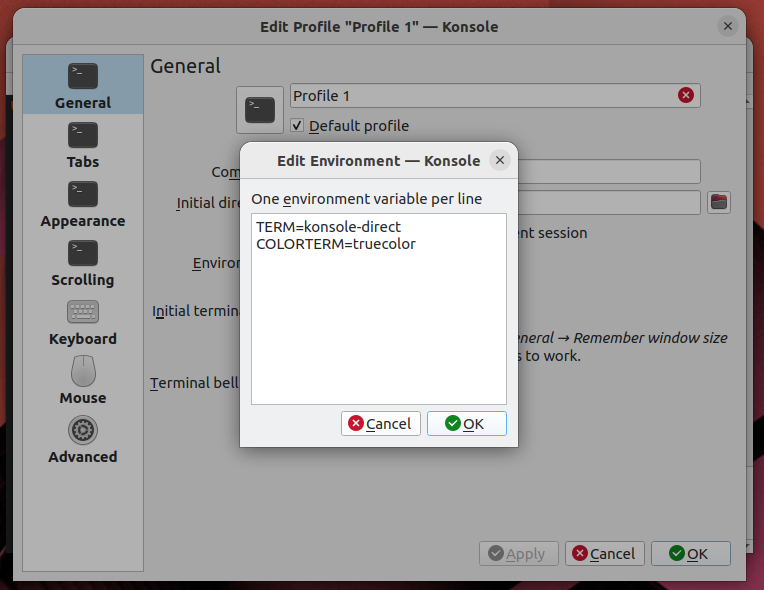
I use Konsole, but I think you could find a similar option in whichever you use.
Konsole's TERM value selection ssh
Often, the first thing I do when opening a terminal is to
sshsomewhere else. Fortunately, this is easy, as long as the remote host has the same terminfo record.sshcarries your TERM value into the new shell.tmux
But then you load
tmuxand TERM is set toscreen! To fix this, overridedefault-terminalin your~/.tmux.conf:set -g default-terminal "tmux-direct"For extra credit, consider setting
tmux-directconditionally with%ifwhen the outer TERM supports 24-bit color, otherwise leaving the default ofscreenortmux-256color. And then let me know how you did it. :Pmosh
While recent mosh does support 24-bit color, it only advertises 8 or 256 colors. Thus, it’s up to you to set TERM appropriately.
Mosh aims for xterm compatibility, but unfortunately only supports semicolon syntax for SGR 38 and 48, so
TERM=xterm-directdoes not work. So far, I’ve found thatvscode-directis the closest toxterm-direct.There is no convenient “I’m running in mosh” variable, so I wrote a
detect-mosh.rsRust script and called it from.bashrc:unamer=$(uname -r) unameo=$(uname -o) if [[ ! "$TMUX" ]]; then if [[ "$unamer" == *Microsoft ]]; then # WSL 1 export TERM=vscode-direct elif [[ "$unameo" == Cygwin ]]; then # Eh, could just configure mintty to set mintty-direct. export TERM=vscode-direct elif detect-mosh 2>/dev/null; then # This should be xterm-direct, but mosh does not understand SGR # colon syntax. export TERM=vscode-direct fi fiIt works by checking whether the shell process is a child of
mosh-server.The jury’s still out on whether it’s a good idea to compile Rust in the critical path of login, especially into an underpowered host like my Intel Atom NAS or a Raspberry Pi.
It Works!
Beautiful Emacs themes everywhere!
Emacs within tmux within mosh This was a ton of work, but I learned a lot, and, perhaps most importantly, I now feel confident I could debug any kind of wonky terminal behavior in the future.
To recap:
- Terminals don’t agree on syntax and capabilities.
- Terminfo is how those capabilities are queried.
- Terminfo is often limited, sometimes inaccurate, and new terminfo versions are released infrequently.
What’s Next?
If you were serious about writing software to take full advantage of modern terminal capabilities, it would be time to break from terminfo.
I imagine such a project would look like this:
- Continue to use the TERM variable because it’s well-supported.
- Give programs knowledge of terminals independent of the age of the
operating system or distribution they’re running on:
- Programs would link with a frequently-updated (Rust?) library.
- Said library would contain a (modern!) terminfo database representing, say, the last 10 years of terminal emulators, keyed on (name, version). Notably, the library would not pretend to support any hardware terminals, because they no longer exist. We can safely forget about padding, for example.
- Continue to support the terminfo file format and OS-provided terminfo files on disk, with some protocol for determining which information is most-up-to-date.
- Allow an opt-in TERMVERSION to differentiate between the capabilities of, for example, 2022’s Konsole and 2023’s Konsole.
- Allow describing modern terminal capabilities (like 24-bit color, 256-color palette animation, URL links, Kitty’s graphics protocol) in an accurate, unambiguous format, independent of the timeline of new ncurses releases.
- Backport modern terminal descriptions to legacy programs by
providing a program to be run by
.bashrcthat:- Uses TERM and TERMVERSION to generate a binary terminfo file in
$HOME/.terminfo/, which ncurses knows how to discover. - Generates unambiguous 24-bit color capabilities like
RGB,setf24, andsetb24, despite the fact that getting them added to terminfo has been politically untenable. - Otherwise, assumes RGB-unaware programs will assume the 256-color
palette, and leaves
colors#0x100,initc,ocin place. Palette animation is a useful, widely-supported feature.
- Uses TERM and TERMVERSION to generate a binary terminfo file in
Let me know if you’re interested in such a project!
-
Reference Counting Things
Reference counting is cheap and easy. An integer starts at one, increments on every new reference, and whoever decrements it to zero is responsible for deallocation.
If references are shared across threads, increments and decrements must be atomic.
Decades ago, I wrote an audio library that shipped in a couple commercial games. Things you’d find on CD in the bargain bin at Walmart. The ABI was modeled after COM and most objects were reference-counted. At the time I’d never seen a dual-CPU system, and thought
inc [refcount]anddec [refcount]are single instructions. It will be fine, right?!Dual-core didn’t yet exist, but some people had dual-socket boards, and we started seeing crash reports after the CDs were burned… oops.
(On the bright side, since I was religious about maintaining stable ABIs, users could just drop the fixed DLL into place.)
Cost of Atomics
Atomics are more expensive than non-atomic operations.
incis a handful of cycles.lock inceven uncontended, can be dozens.When C++ standardized
std::shared_ptrin 2011 they didn’t even bother with a non-atomic version. C++ isn’t safe enough, and there was a feeling that atomic increments and decrements were common enough that they’d get optimized in hardware. That was correct – it just took a while.Rust’s safety guarantees, on the other hand, allow safe use of an unsynchronized
Rcif you don’t want to pay forArc.It’s pretty easy for reference counting overhead to show up in profiles. Sometimes it’s the accidental
shared_ptrcopy in a hot loop or a recursive.clone()in Rust. Last time I wrote Swift, atomic reference counts were a major cost.The hardware is getting better. On Apple Silicon and AMD Zen 3, uncontended atomic increments and decrements are almost as cheap as non-atomic. (Interestingly, atomics are also cheap on my 64-bit, 4-thread Intel Atom from 2011.) These optimizations are a big deal, and if all CPUs worked that way, maybe this blog post would end here.
Alas, data centers are still filled with years-old Intel CPUs or non-Apple ARM implementation. It’s worth spending some time in software to avoid synchronization if possible.
Avoid 0-to-1
Here’s an easy but commonly-missed trick. Initialize your reference counts to 1.
For whatever reason (symmetry?), it’s common to see implementations like:
struct Object {
  std::atomic<size_t> count{0};
};

struct ObjectPtr {
  ObjectPtr(Object* p): p{p} {
    p->count.fetch_add(1, std::memory_order_relaxed);
  }
  Object* p;
};
I haven’t seen a compiler realize it can replace the initial value with 1 and avoid atomics when new objects are allocated.
Avoid 1-to-0
A typical release implementation is written:
struct ObjectPtr {
  ~ObjectPtr() {
    if (1 == p->count.fetch_sub(1, std::memory_order_acq_rel)) {
      delete p;
    }
  }
  Object* p;
}
However, actually decrementing the count to zero is not necessary. We only need to know if we’re the last reference. Thus, we can write:
  ~ObjectPtr() {
    if (1 == p->count.load(std::memory_order_acquire) ||
        1 == p->count.fetch_sub(1, std::memory_order_acq_rel)) {
      delete p;
    }
  }
Maybe the impact on code size isn’t worth it. That’s your call. On older Intel CPUs, in situations where most objects only have one reference, it can be a meaningful optimization.
Maged Michael implemented a fancier version of this algorithm in gcc’s libstdc++.
Implementing these two optimizations in Watchman was a material win for code that allocated or deallocated large trees.
Biased Reference Counting
Swift implicitly reference-counts many of its objects. When I worked at Dropbox, we measured reference counting operations as a substantial portion of our overall CPU time.
In 2018, researchers at University of Illinois Urbana-Champaign proposed an algorithm called Biased Reference Counting that splits the reference count into two. One is biased to a specific thread and can be updated without atomic operations. The other reference count is atomic and shared among the remaining threads. Unifying these two counts requires extra bookkeeping, especially in languages like Swift or C++ where unsynchronized values can easily migrate across threads.
The hybrid_rc Rust crate has an implementation of this algorithm that takes advantage of Rust’s type system (in particular, by not providing
Sendfor thread-local references) to avoid extra bookkeeping.I’m curious if anyone uses biased reference counting in practice.
Split Reference Counting
Channel and promise implementations need to track two reference counts: one for readers and one for writers. When either reaches zero, the channel is closed. Waiting senders or receivers are notified that no more messages can be sent.
Rust’s built-in channels use two atomic counters and an atomic bit. The bit is necessary to determine which thread should deallocate in the case that a thread drops the last reader exactly as another thread drops the last writer.
It’s possible to pack all of these into a single 64-bit counter. If each half has 32 bits but the entire counter is updated atomically, no additional state is required to disambiguate who deallocates.
I have a Rust implementation of the above in the splitrc crate.
How Many Bits?
Rust is sound: safe code must not have undefined behavior. std::mem::forget is a safe function. Therefore, it’s possible to run up some reference count
pin a tight loop such as:loop { std::mem::forget(p.clone()); }64-bit counters are effectively infinite. Let’s hypothesize a 4 GHz CPU where increments take one cycle. It would take almost 150 years to overflow.
In contrast, a modern CPU can overflow a 32-bit counter in seconds. You might say (and I’d agree) that a program that holds billions of references is pathological, and need not be supported. On the other hand, in Rust, safe code must never overflow and cause use-after-free.
Therefore, any 32-bit counter (even
usizeandAtomicUsizeon 32-bit CPUs) must detect and handle overflow.Rcusesusize::wrapping_addto detect wraparound.Arcreserves half the range ofusizeto detect overflow. This is safe under the assumption that billions of threads aren’t simultaneously incrementing the counter.Rust reference counts typically abort on overflow rather than panic. I assume this is because panics can be caught and ignored. There may be codegen benefits as well. However, in the context of long-lived server processes that concurrently handle requests, it’s nice to catch panics and fail the one buggy request instead of aborting.
splitrcallocates a panic range and an abort range to get the best of both worlds.In practice, overflowing a reference count should never happen. Reference counts should never get that high. But that sounds like famous last words, and I’ll happily pay a branch and some cold code for a loud failure.
Older versions of the Linux kernel even had a use-after-free caused by reference count overflow.
Weak References
Like split reference counts, supporting weak references requires maintaining two counts: a strong count and a weak count. When the strong count reaches zero, the referenced value is destructed. But the memory can’t be deallocated until both counts reach zero.
The approach taken by Rust’s
Arcis to maintain two separate counters. All strong references share an extra weak reference. When the last strong reference is dropped, the extra weak reference is dropped too.Memory is deallocated when the last weak reference reaches zero.
libc++ takes a similar approach with the interesting caveat that it starts counting at zero and waits until the counts decrement to -1.
Supporting weak references has a small cost. You need space for two counters and some implementations actually perform two atomic decrements when the last strong reference is dropped.
It’s possible to do better: like splitrc, the strong and weak references can be packed into a single 64-bit integer with overflow detection on each half. Each new reference is a single atomic addition. As in the 1-to-0 optimization above, an optimistic load can avoid an atomic RMW in the common case that no weak references are alive.
If you don’t need weak references, the Rust triomphe crate provides some faster alternatives to the standard library.
Count First Reference From Zero or One?
It’s typical for reference counts to start at one and decrement to zero. But that’s not the only option. As mentioned above, libc++ initializes its references to value zero, meaning one reference. Decrement checks whether the count underflows to -1.
Unless you’re the most standard of libraries, the tiny differences in instruction selection don’t matter. But they’re fun to look at, so let’s see. (Compiler Explorer)
Initializing values to zero is smaller in most ISAs:
struct RC {
    size_t s;
    size_t w;
};

void init_zero(RC& rc) {
    rc.s = 0;
    rc.w = 0;
}

void init_one(RC& rc) {
    rc.s = 1;
    rc.w = 1;
}
x86-64 (gcc 13.2):
init_zero(RC&):
        pxor    xmm0, xmm0
        movups  XMMWORD PTR [rdi], xmm0
        ret
init_one(RC&):
        movdqa  xmm0, XMMWORD PTR .LC0[rip]
        movups  XMMWORD PTR [rdi], xmm0
        ret
gcc chooses to load the pair of ones from a 128-bit constant. clang instead generates two stores.
x86-64 (clang 17):
init_zero(RC&):                       # @init_zero(RC&)
        xorps   xmm0, xmm0
        movups  xmmword ptr [rdi], xmm0
        ret
init_one(RC&):                        # @init_one(RC&)
        mov     qword ptr [rdi], 1
        mov     qword ptr [rdi + 8], 1
        ret
ARM64 gcc generates equivalent code to x86-64. clang on ARM64 instead broadcasts a constant 1 into a vector and stores it.
64-bit ARM (clang 17):
init_zero(RC&):                       // @init_zero(RC&)
        stp     xzr, xzr, [x0]
        ret
init_one(RC&):                        // @init_one(RC&)
        mov     w8, #1                          // =0x1
        dup     v0.2d, x8
        str     q0, [x0]
        ret
As expected, zero-initialization is slightly cheaper.
Increment will generate the same instructions no matter where the count starts, of course. (If using a 32-bit counter, overflow checks are required. Choosing an overflow range that allows branching on the sign bit can generate a smaller hot path, but that’s almost independent of where to start counting.)
Decrement is a little interesting.
void dec_zero_exact(std::atomic<size_t>& c) {
    if (0 == c.fetch_sub(1, std::memory_order_acq_rel)) {
        dealloc();
    }
}

void dec_zero_less(std::atomic<size_t>& c) {
    using ssize_t = std::make_signed_t<size_t>;
    if (0 >= static_cast<ssize_t>(c.fetch_sub(1, std::memory_order_acq_rel))) {
        dealloc();
    }
}

void dec_one(std::atomic<size_t>& c) {
    if (1 == c.fetch_sub(1, std::memory_order_acq_rel)) {
        dealloc();
    }
}
Let’s look at x86-64:
dec_zero_exact(std::atomic<unsigned long>&):    # @dec_zero_exact(std::atomic<unsigned long>&)
        mov        rax, -1
        lock xadd  qword ptr [rdi], rax
        test       rax, rax
        je         dealloc()@PLT                # TAILCALL
        ret
dec_zero_less(std::atomic<unsigned long>&):     # @dec_zero_less(std::atomic<unsigned long>&)
        lock dec  qword ptr [rdi]
        jl        dealloc()@PLT                 # TAILCALL
        ret
dec_one(std::atomic<unsigned long>&):           # @dec_one(std::atomic<unsigned long>&)
        lock dec  qword ptr [rdi]
        je        dealloc()@PLT                 # TAILCALL
        ret
There are two atomic decrement instructions,
lock decandlock xadd.lock decis slightly preferable: it has a similar cost, but its latency is one cycle less on Zen 4, and it’s smaller. (lock xaddalso requires loading -1 into a register.)But, since it doesn’t return the previous value and only sets flags, it can only be used if a following comparison can use those flags.
Therefore, on x86-64, counting from 1 is slightly cheaper, at least with a naive comparison. However, if we sacrifice half the range of the counter type (again, two billion should be plenty), then we can get the same benefits in the counting-from-zero decrement.
Now let’s take a look at ARM64:
dec_zero_exact(std::atomic<unsigned long>&):        // @dec_zero_exact(std::atomic<unsigned long>&)
        mov     x8, #-1                         // =0xffffffffffffffff
        ldaddal x8, x8, [x0]
        cbz     x8, .LBB2_2
        ret
.LBB2_2:
        b       dealloc()
dec_zero_less(std::atomic<unsigned long>&):         // @dec_zero_less(std::atomic<unsigned long>&)
        mov     x8, #-1                         // =0xffffffffffffffff
        ldaddal x8, x8, [x0]
        cmp     x8, #0
        b.le    .LBB3_2
        ret
.LBB3_2:
        b       dealloc()
dec_one(std::atomic<unsigned long>&):                // @dec_one(std::atomic<unsigned long>&)
        mov     x8, #-1                         // =0xffffffffffffffff
        ldaddal x8, x8, [x0]
        cmp     x8, #1
        b.ne    .LBB4_2
        b       dealloc()
.LBB4_2:
        ret
None of the atomic read-modify-writes on ARM64 set flags, so the value has to be explicitly compared anyway. The only difference is that comparing equality with zero is one fewer instruction.
So there we go. All of this instruction selection is likely in the wash. I was hoping for a Dijkstra-like clear winner. The strongest argument to start counts at 1 is that the counter never underflows, allowing multiple counts to be packed into a single integer.
False Sharing
Where the reference count is positioned in the object can matter. If the reference count ends up in the same page as other modified data, concurrent workloads are penalized. By reducing false sharing and making RCU more scalable, Intel improved highly concurrent network performance in Linux by 2-130%.
There may be value in abstracting the count’s location through a vtable, like COM does.
I’ll Stop Here
Reference counting is a long-studied topic. There are saturating counts, counts that saturate into mark-and-sweep, counts that saturate into (logged) leaks, cycle detection, weighted reference counts, deferred increments, combining updates, external counts, but you can read more elsewhere.
I mostly wanted to share some things I’ve recently run into.
-
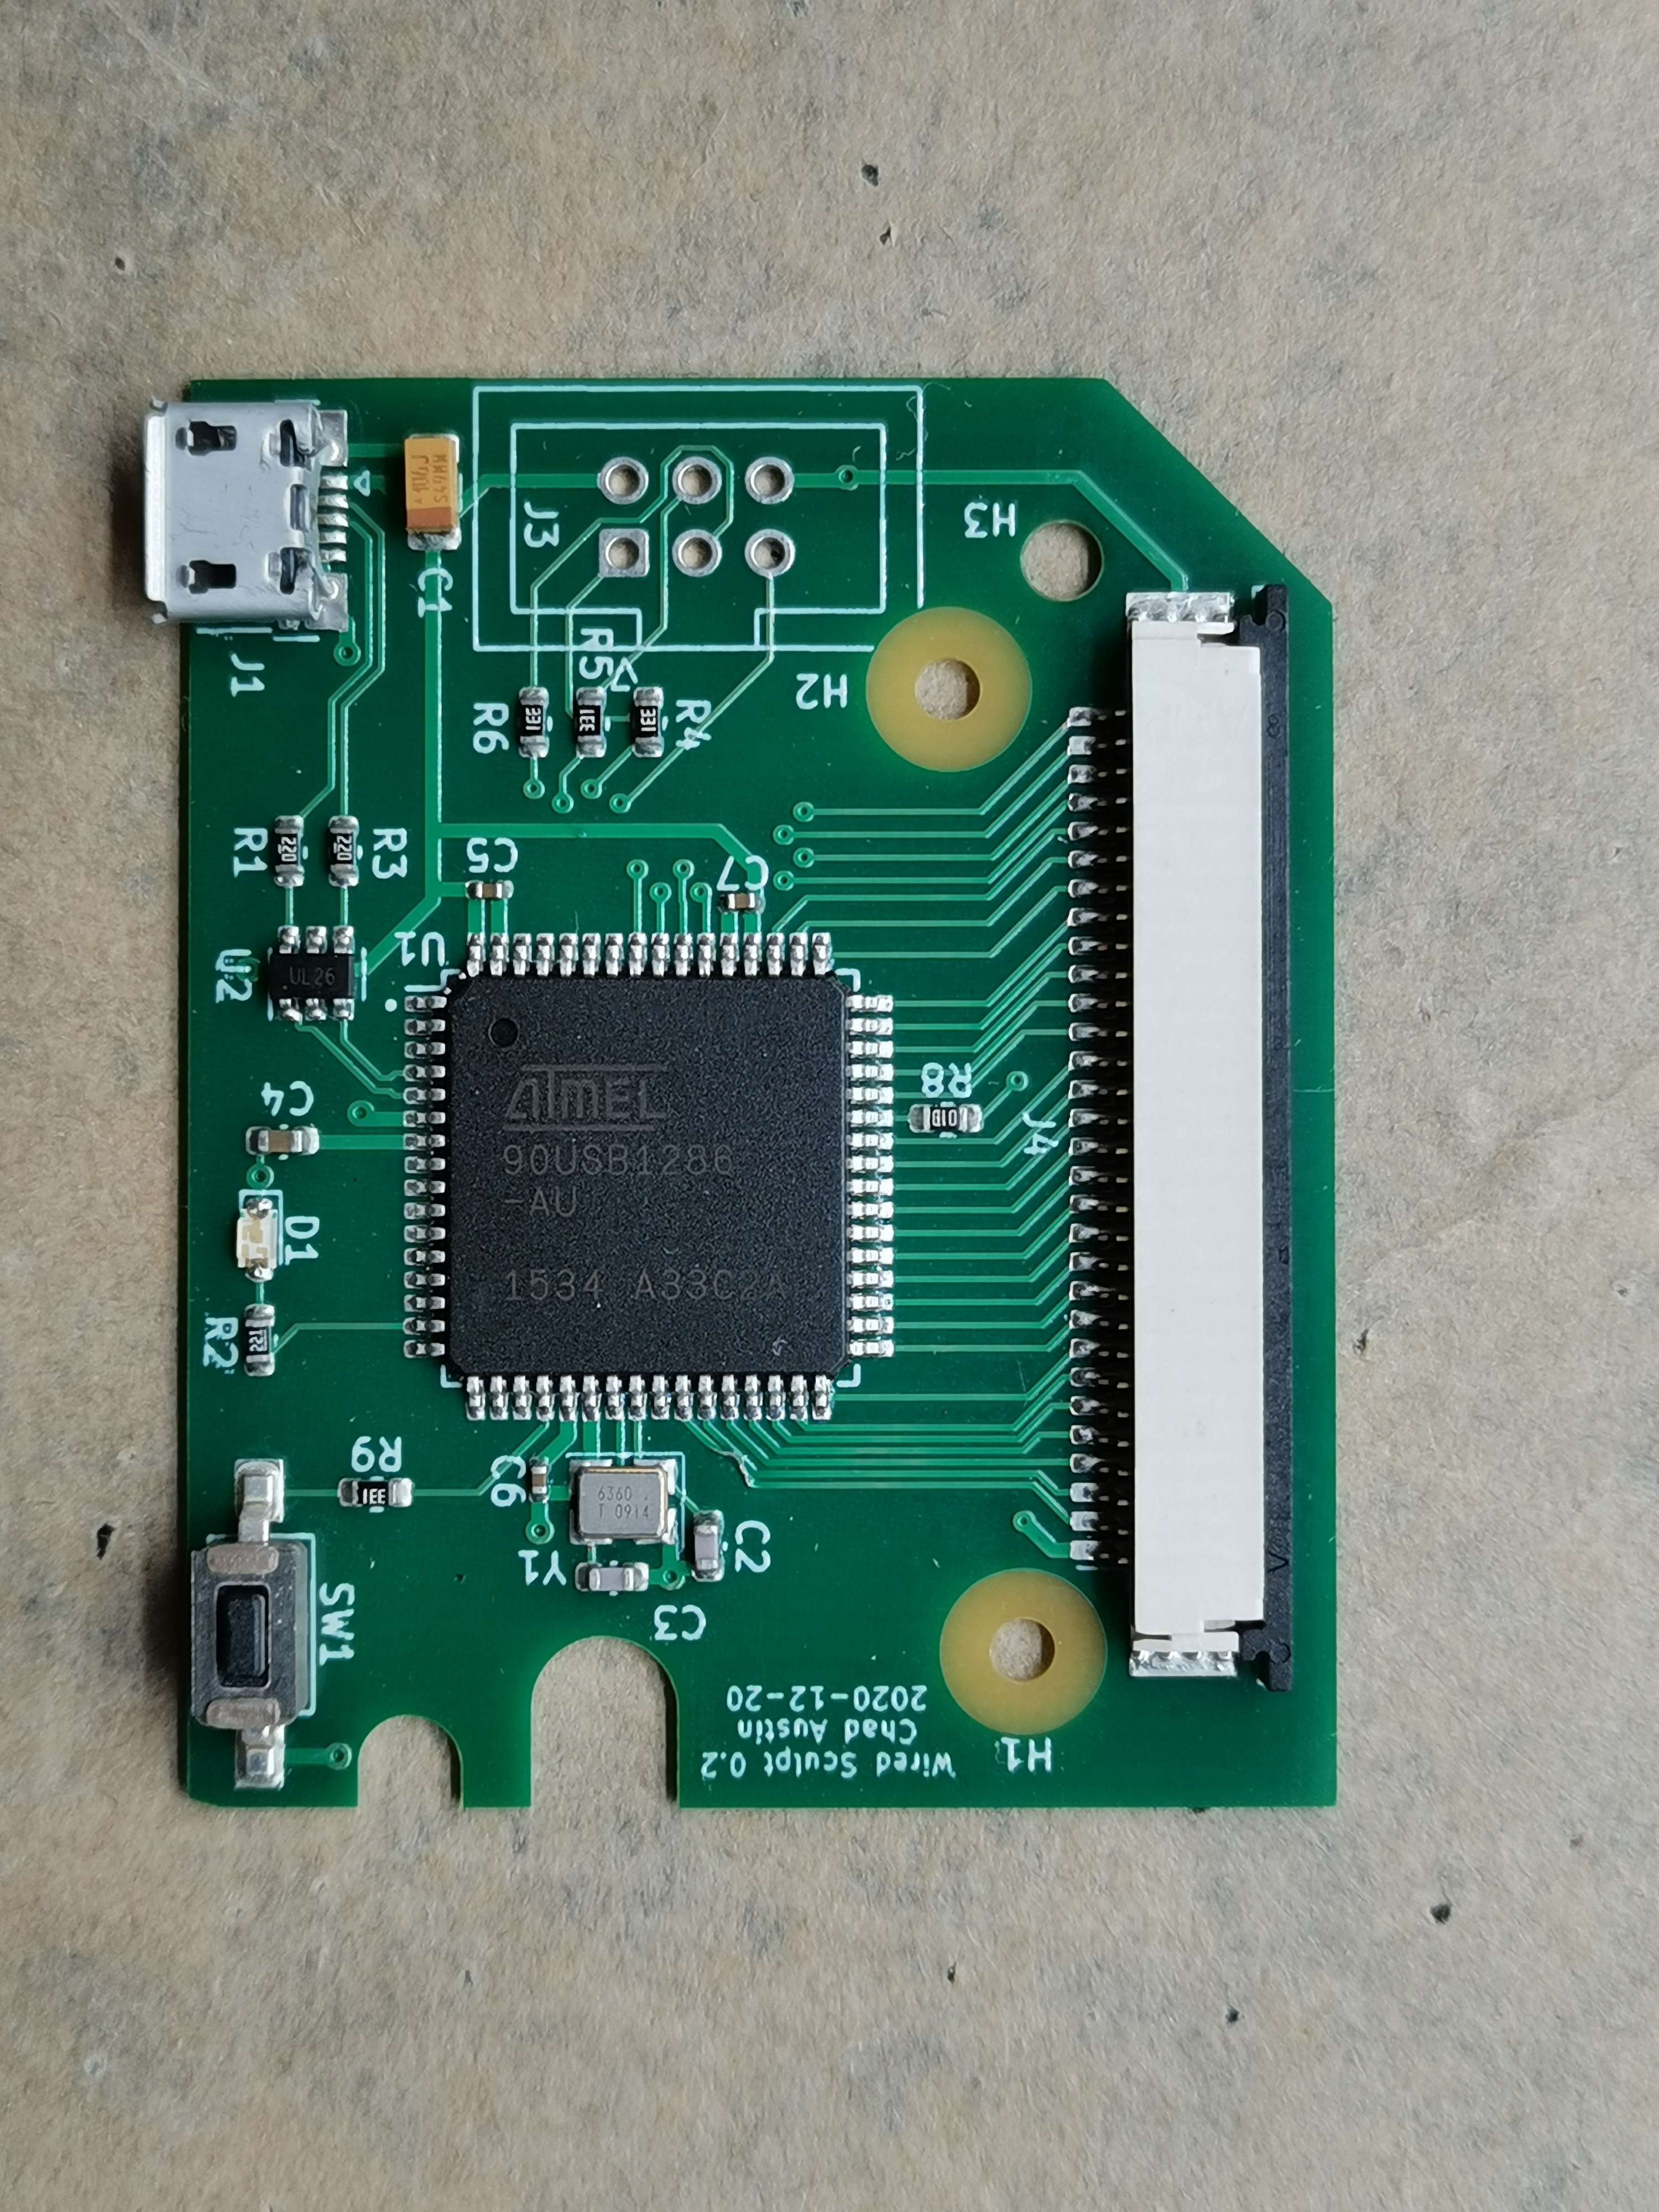
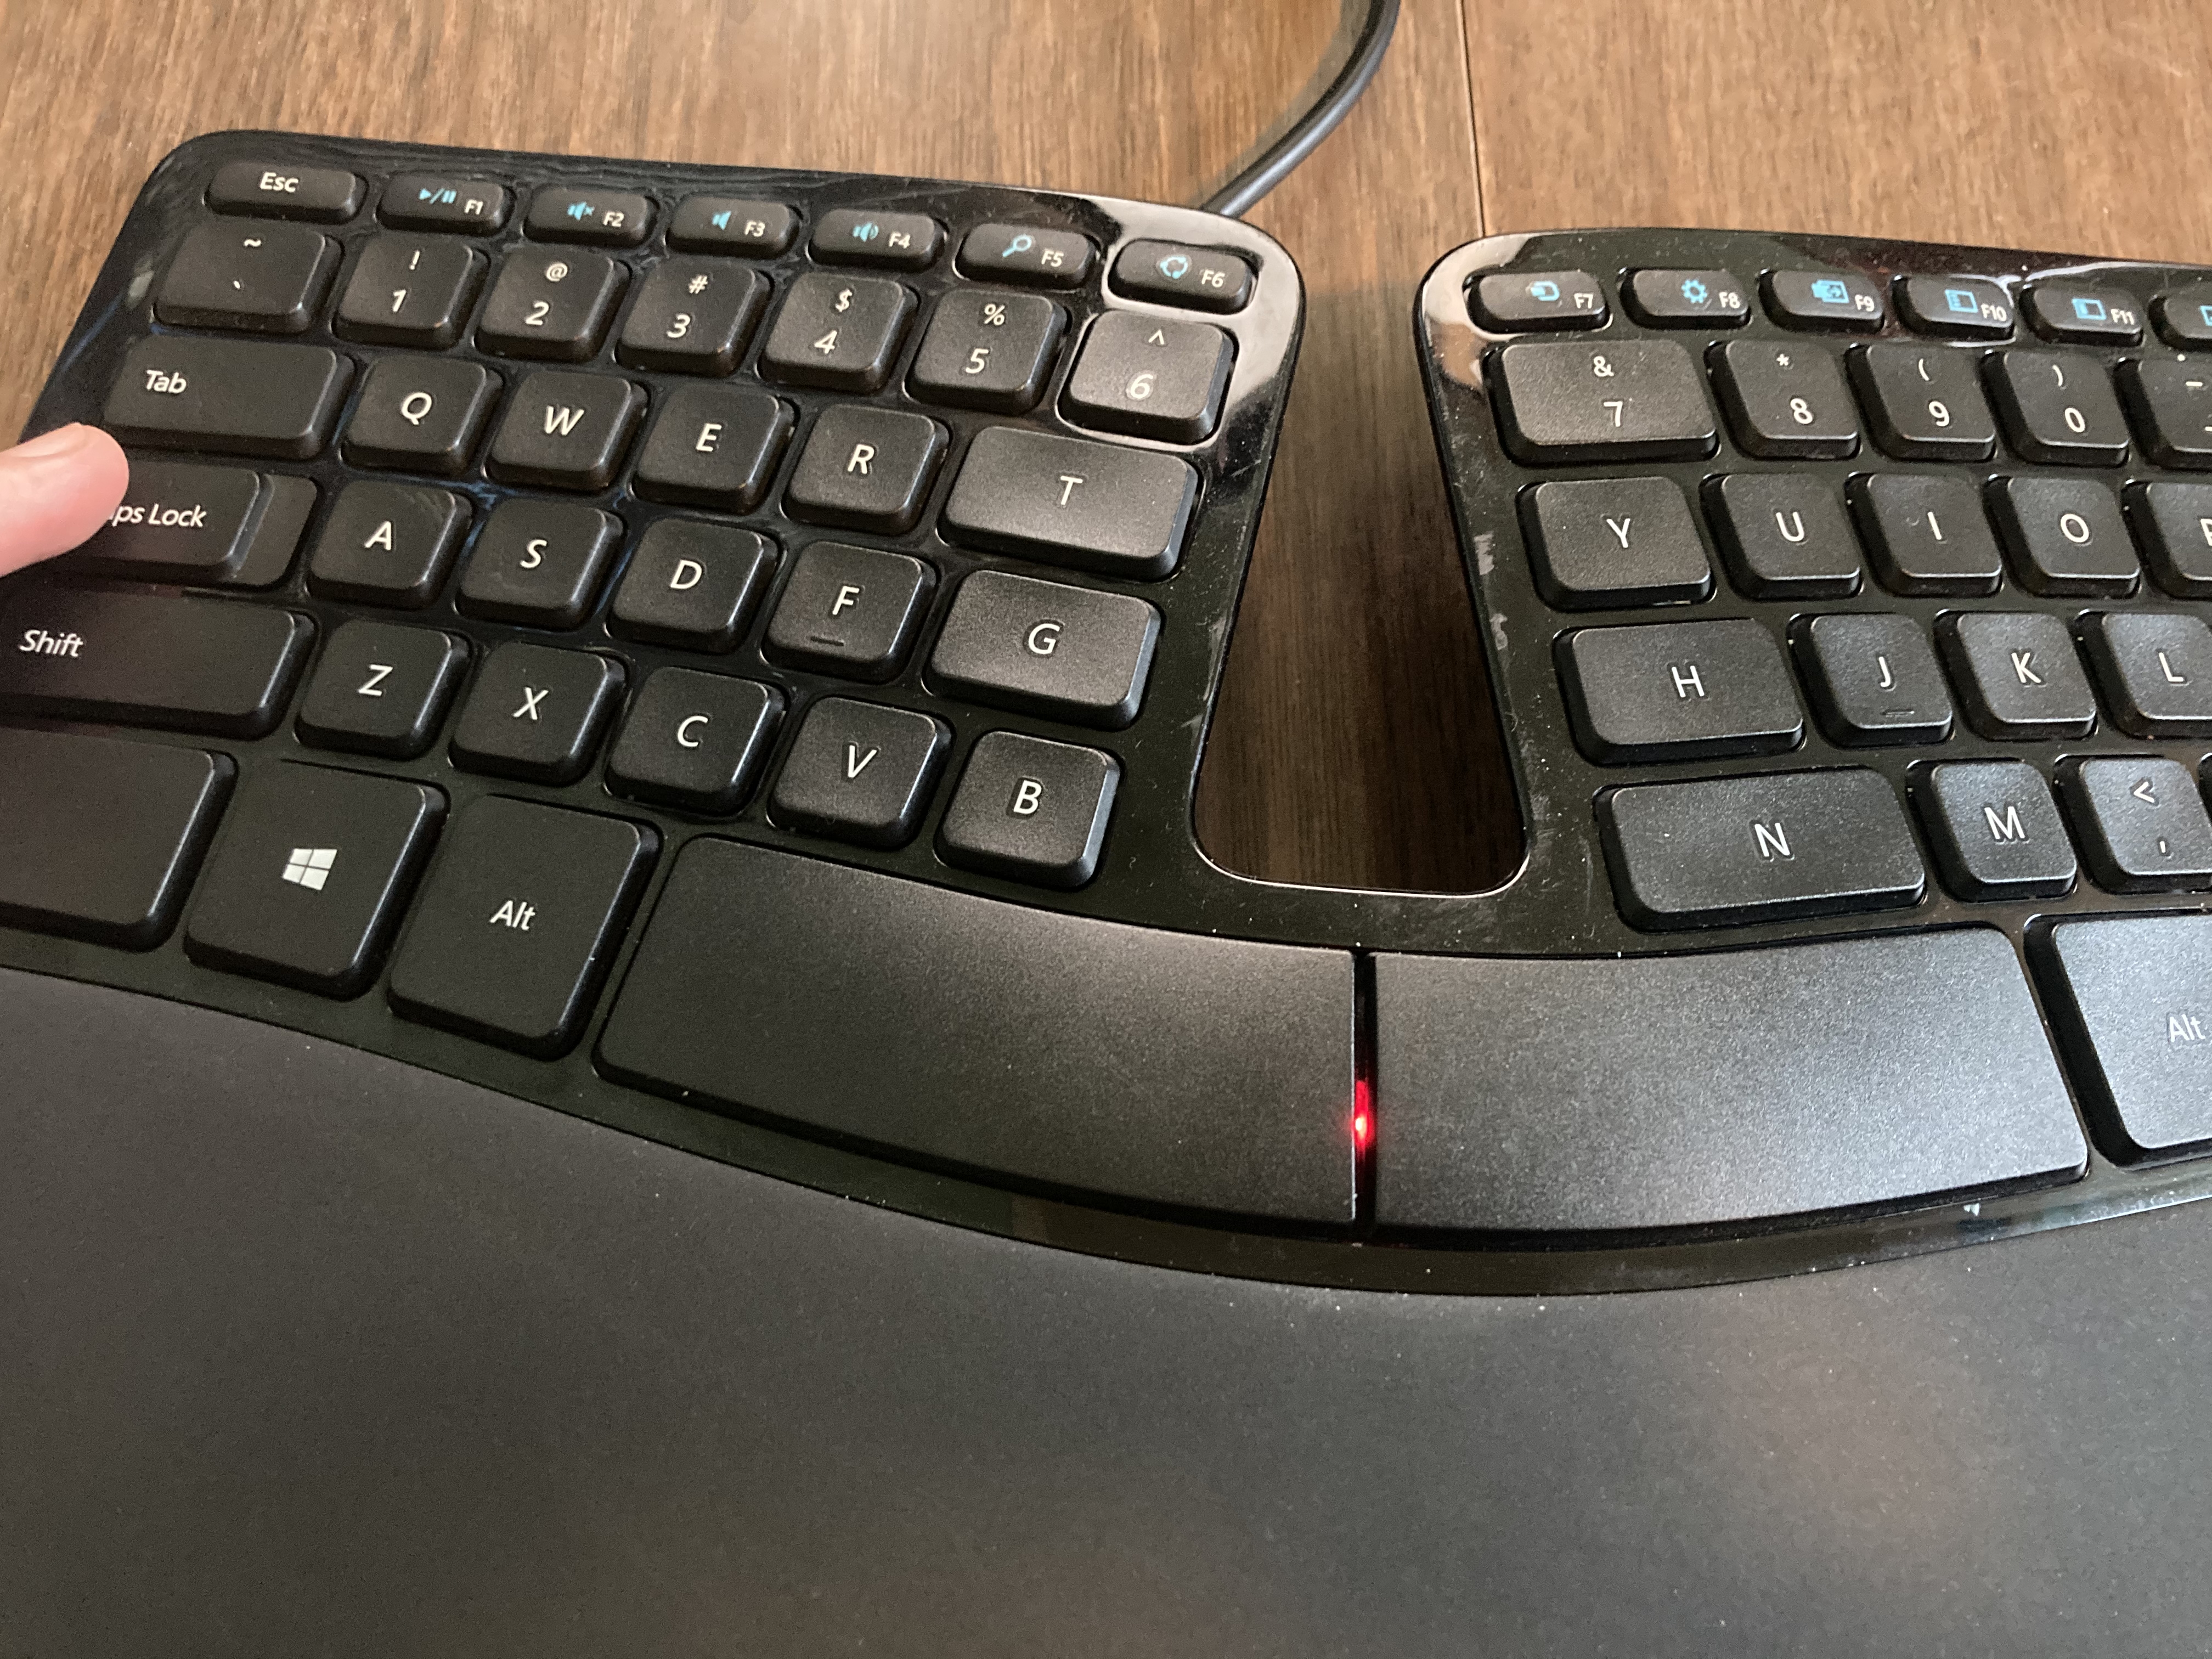
Microsoft Sculpt Wired Conversion Mod
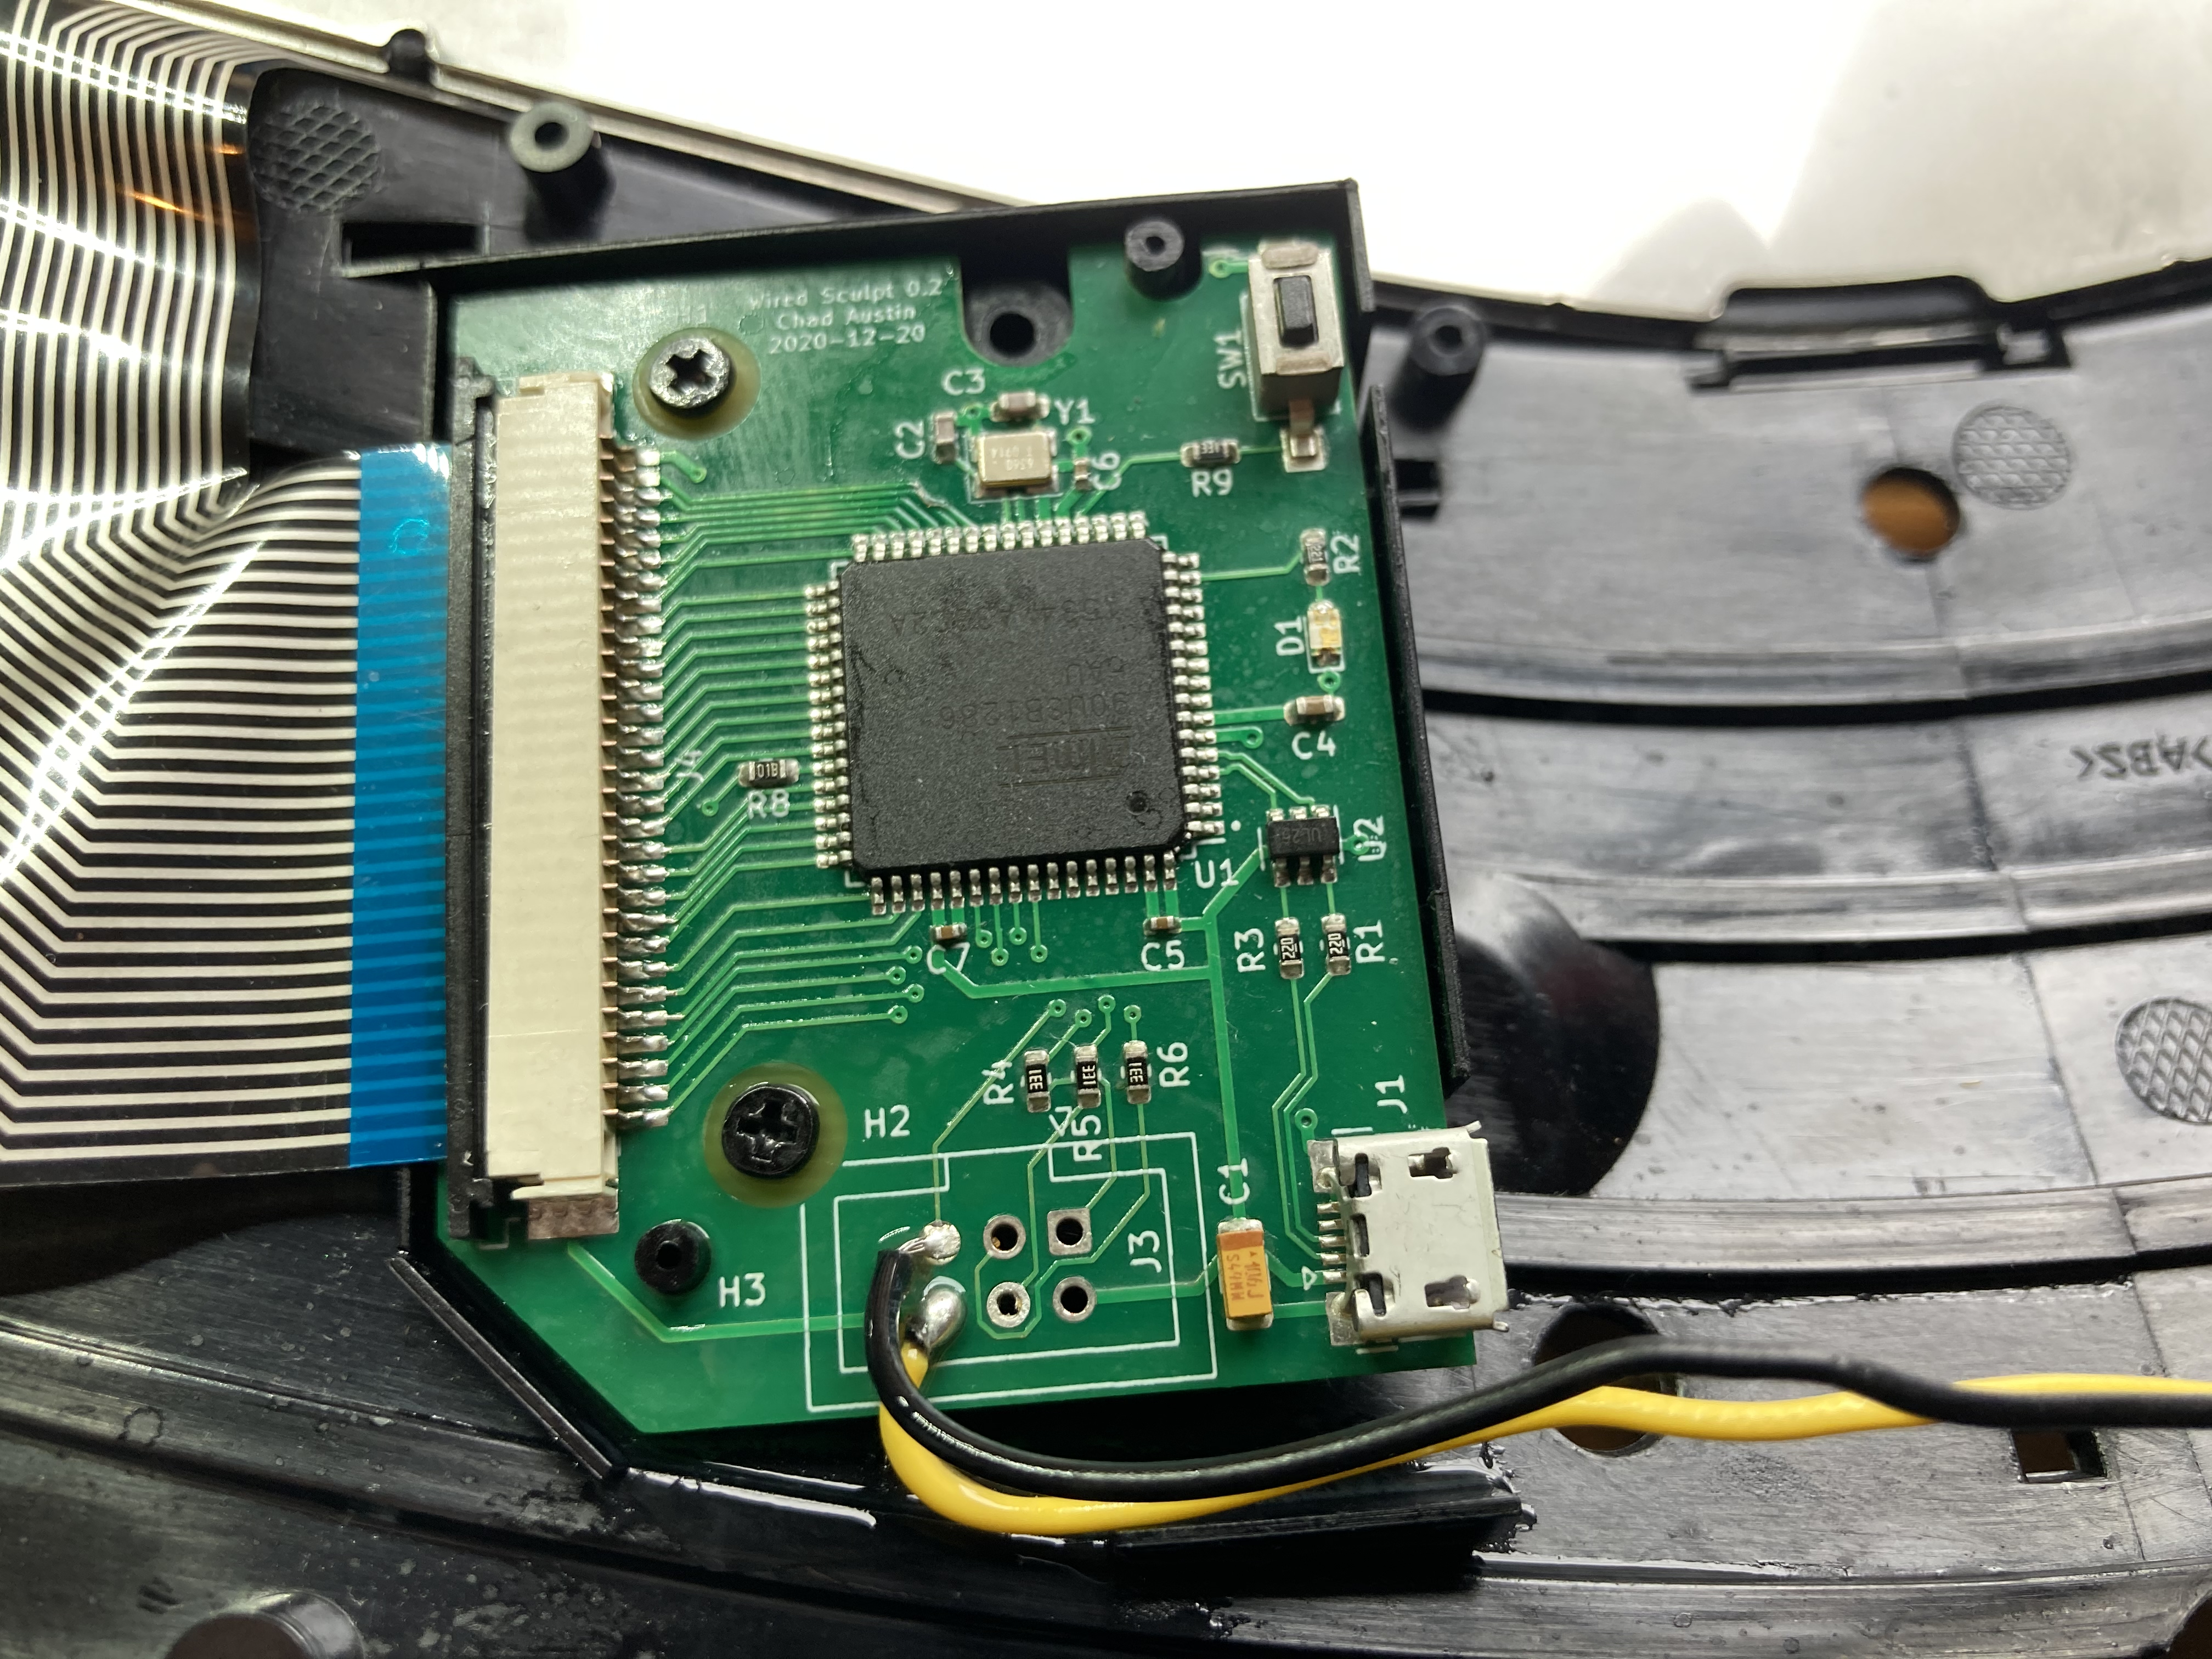
I made a control board for the Microsoft Sculpt wireless keyboard that converts it to wired USB, and now my favorite keyboard is even better.
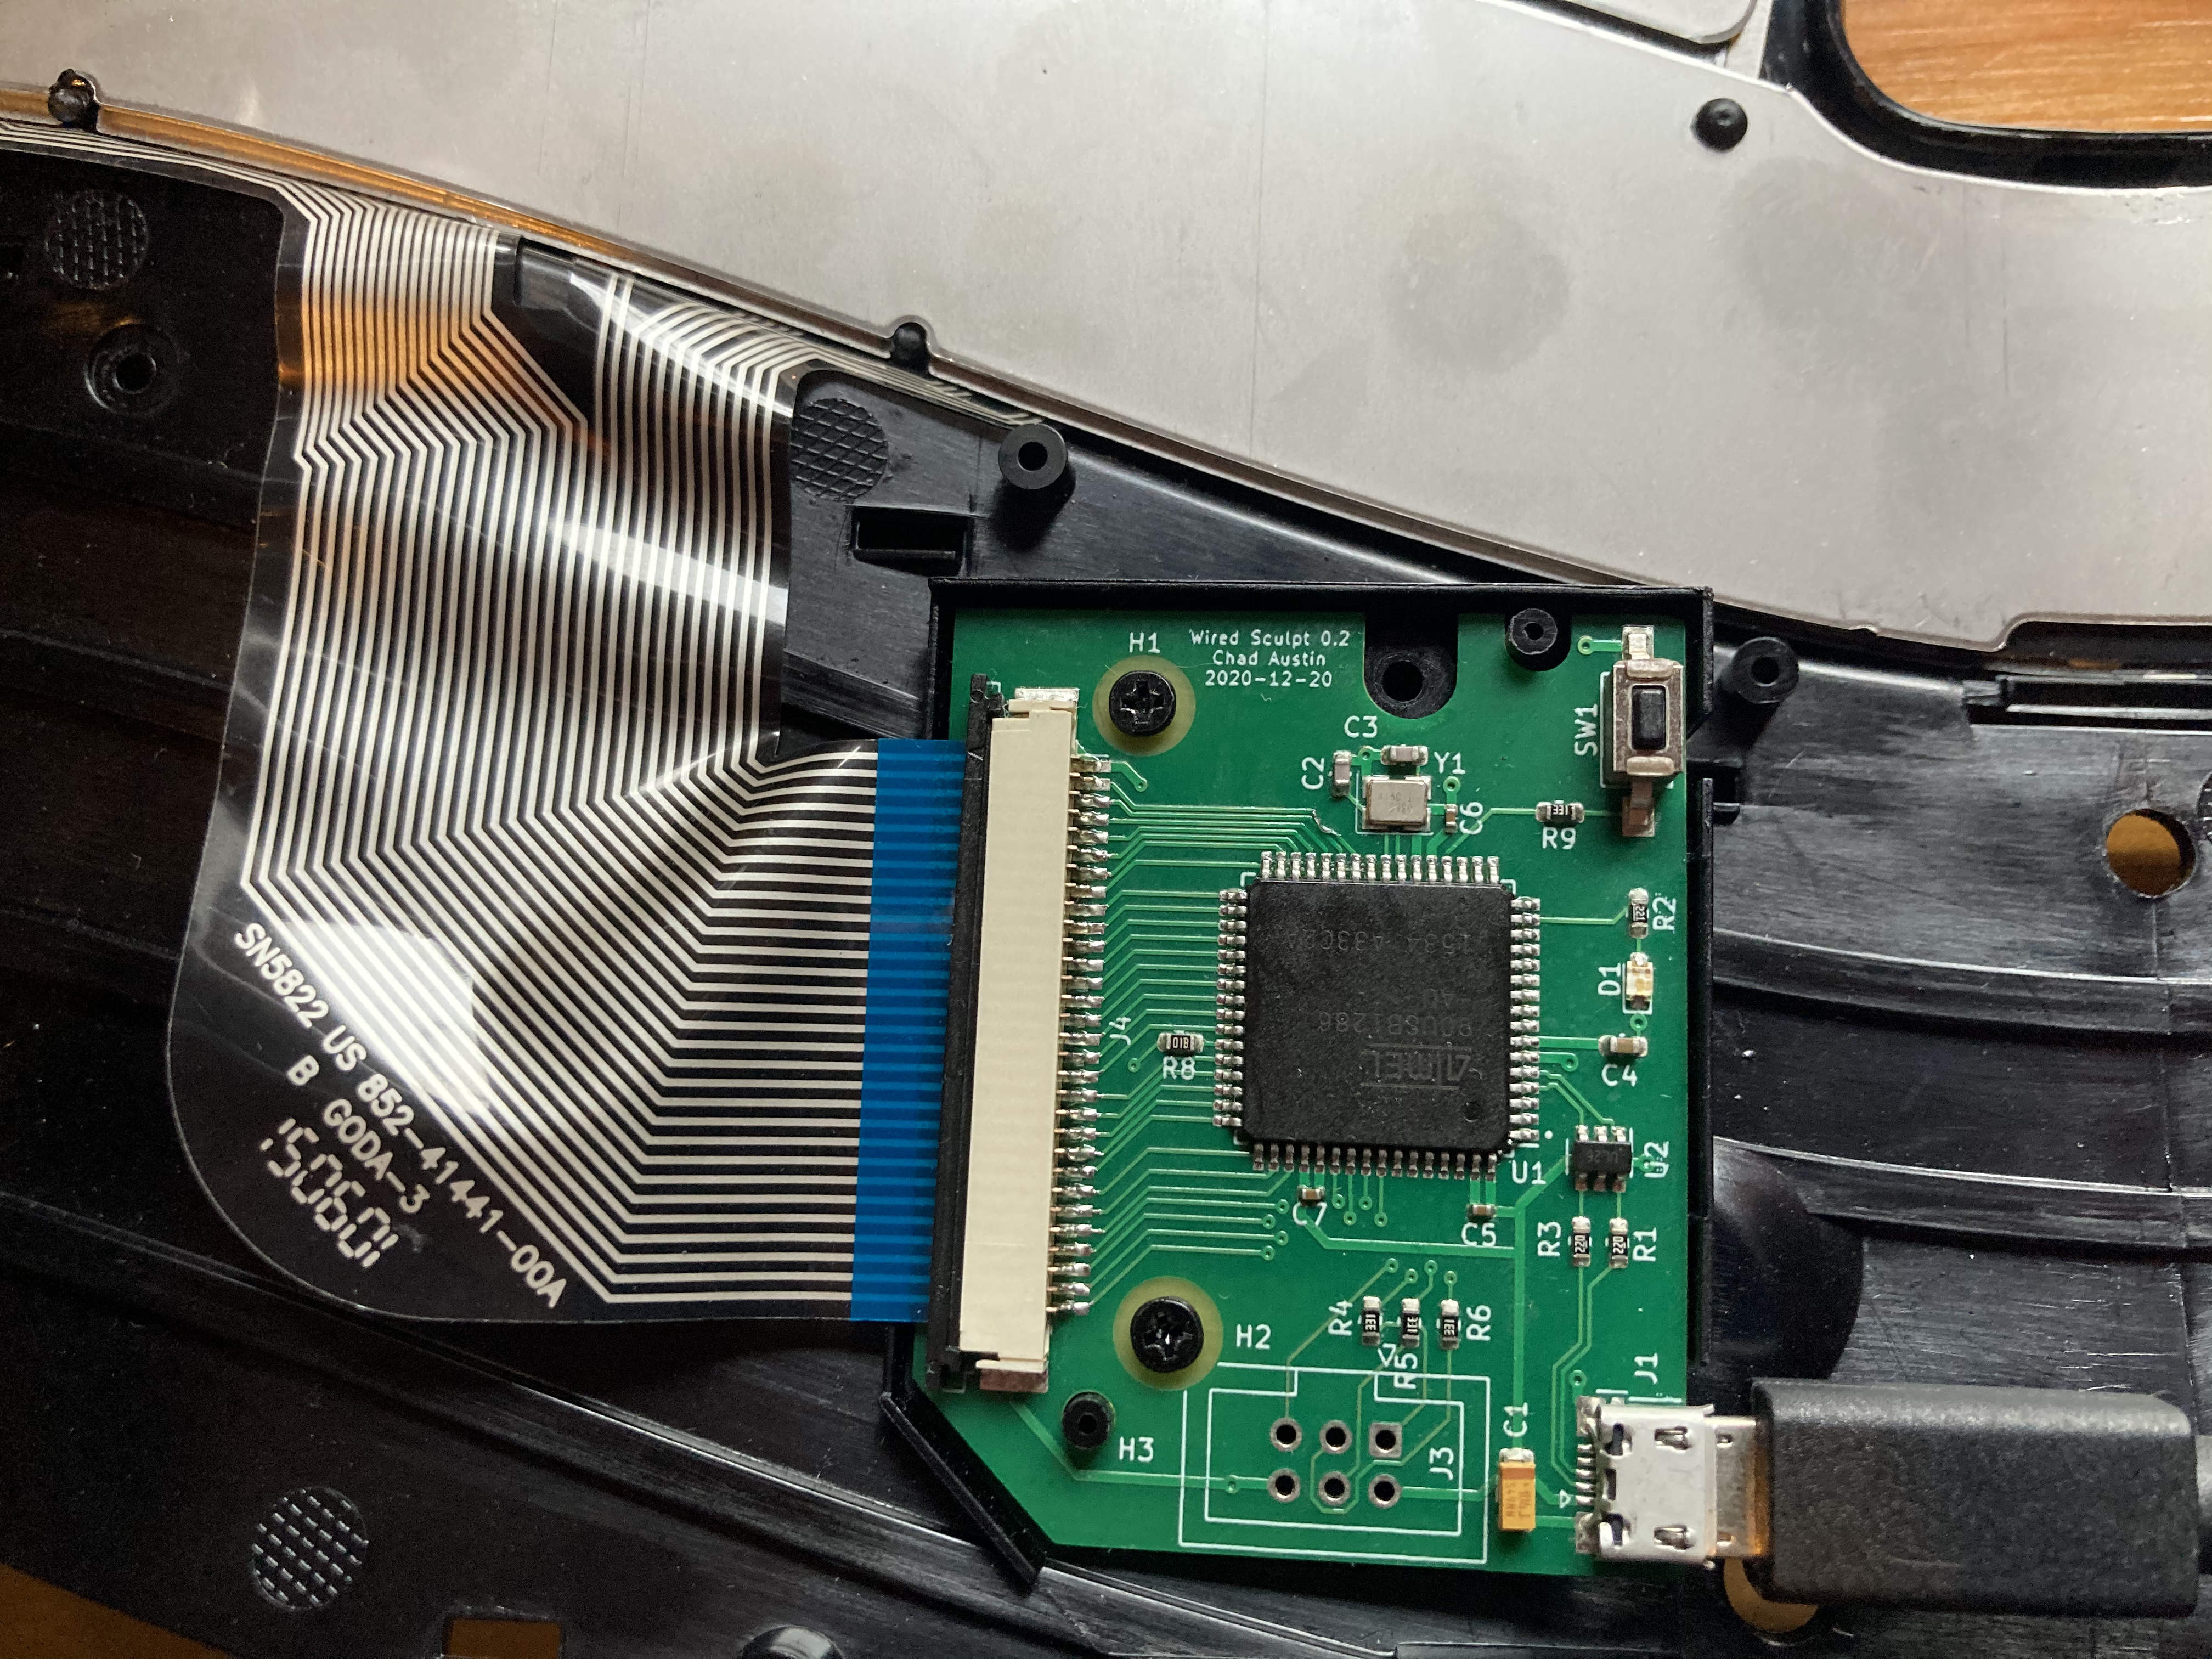
The finished and installed board. 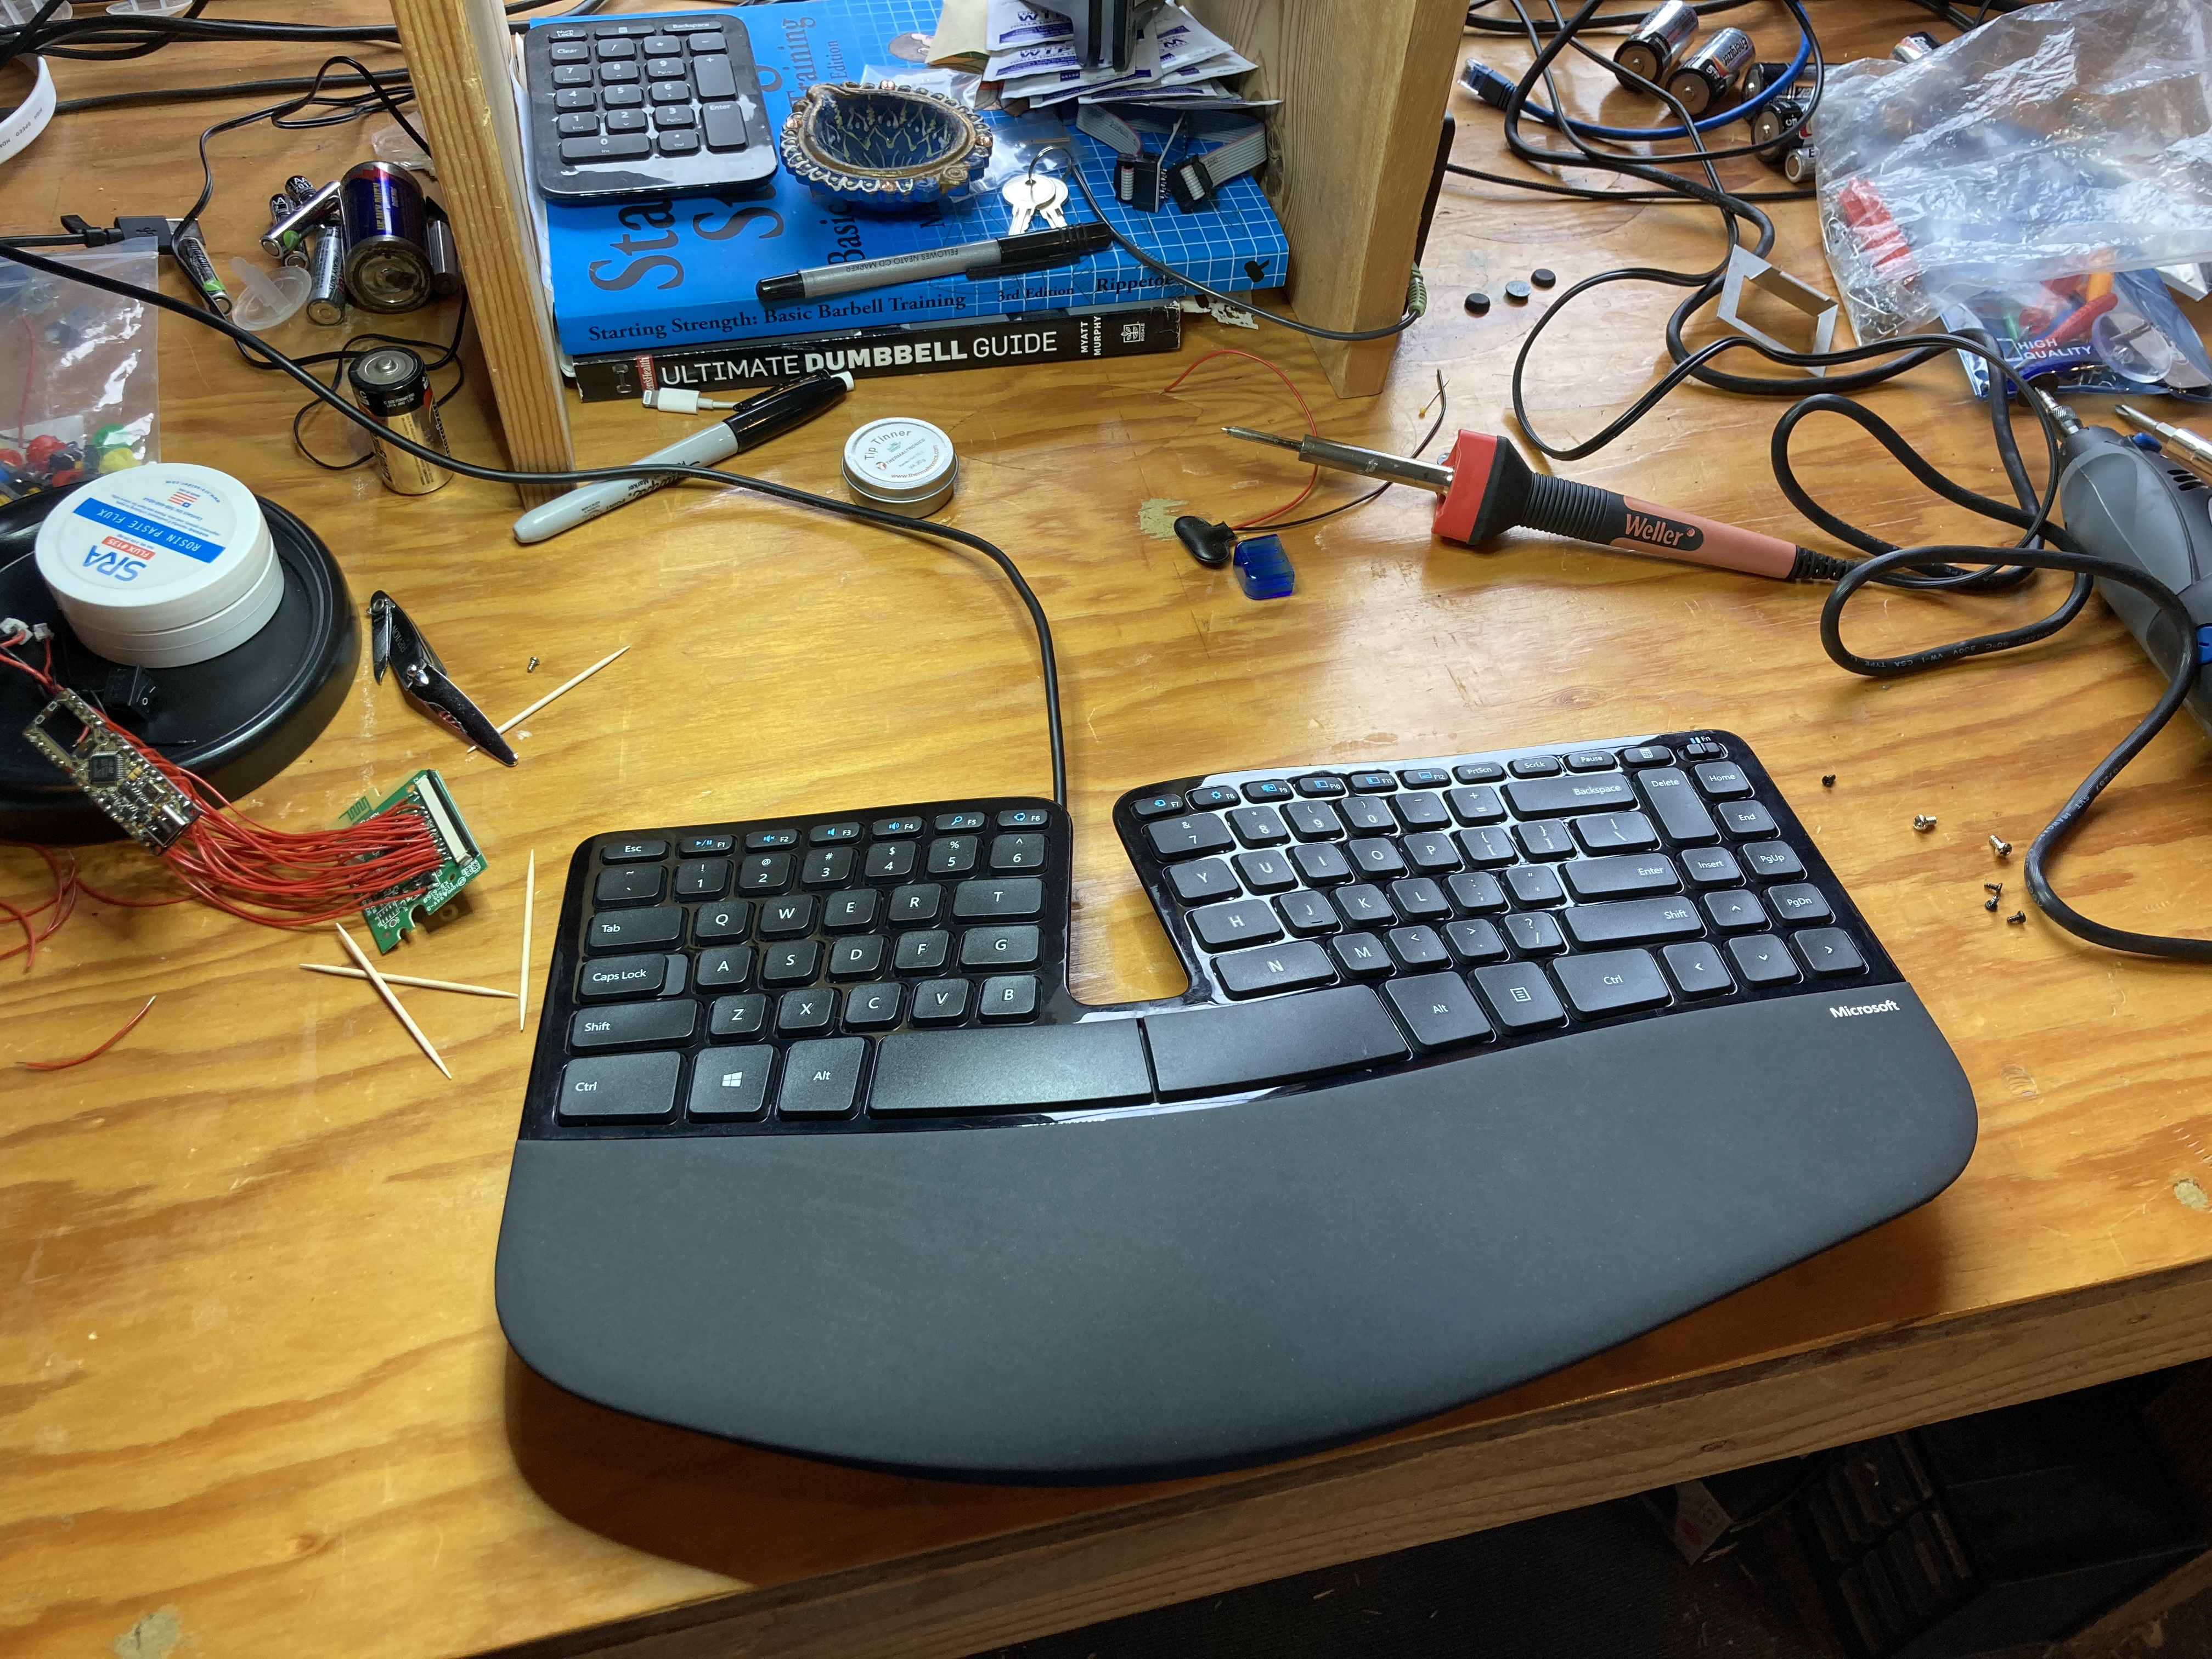
Wired keyboard and the resulting project mess! 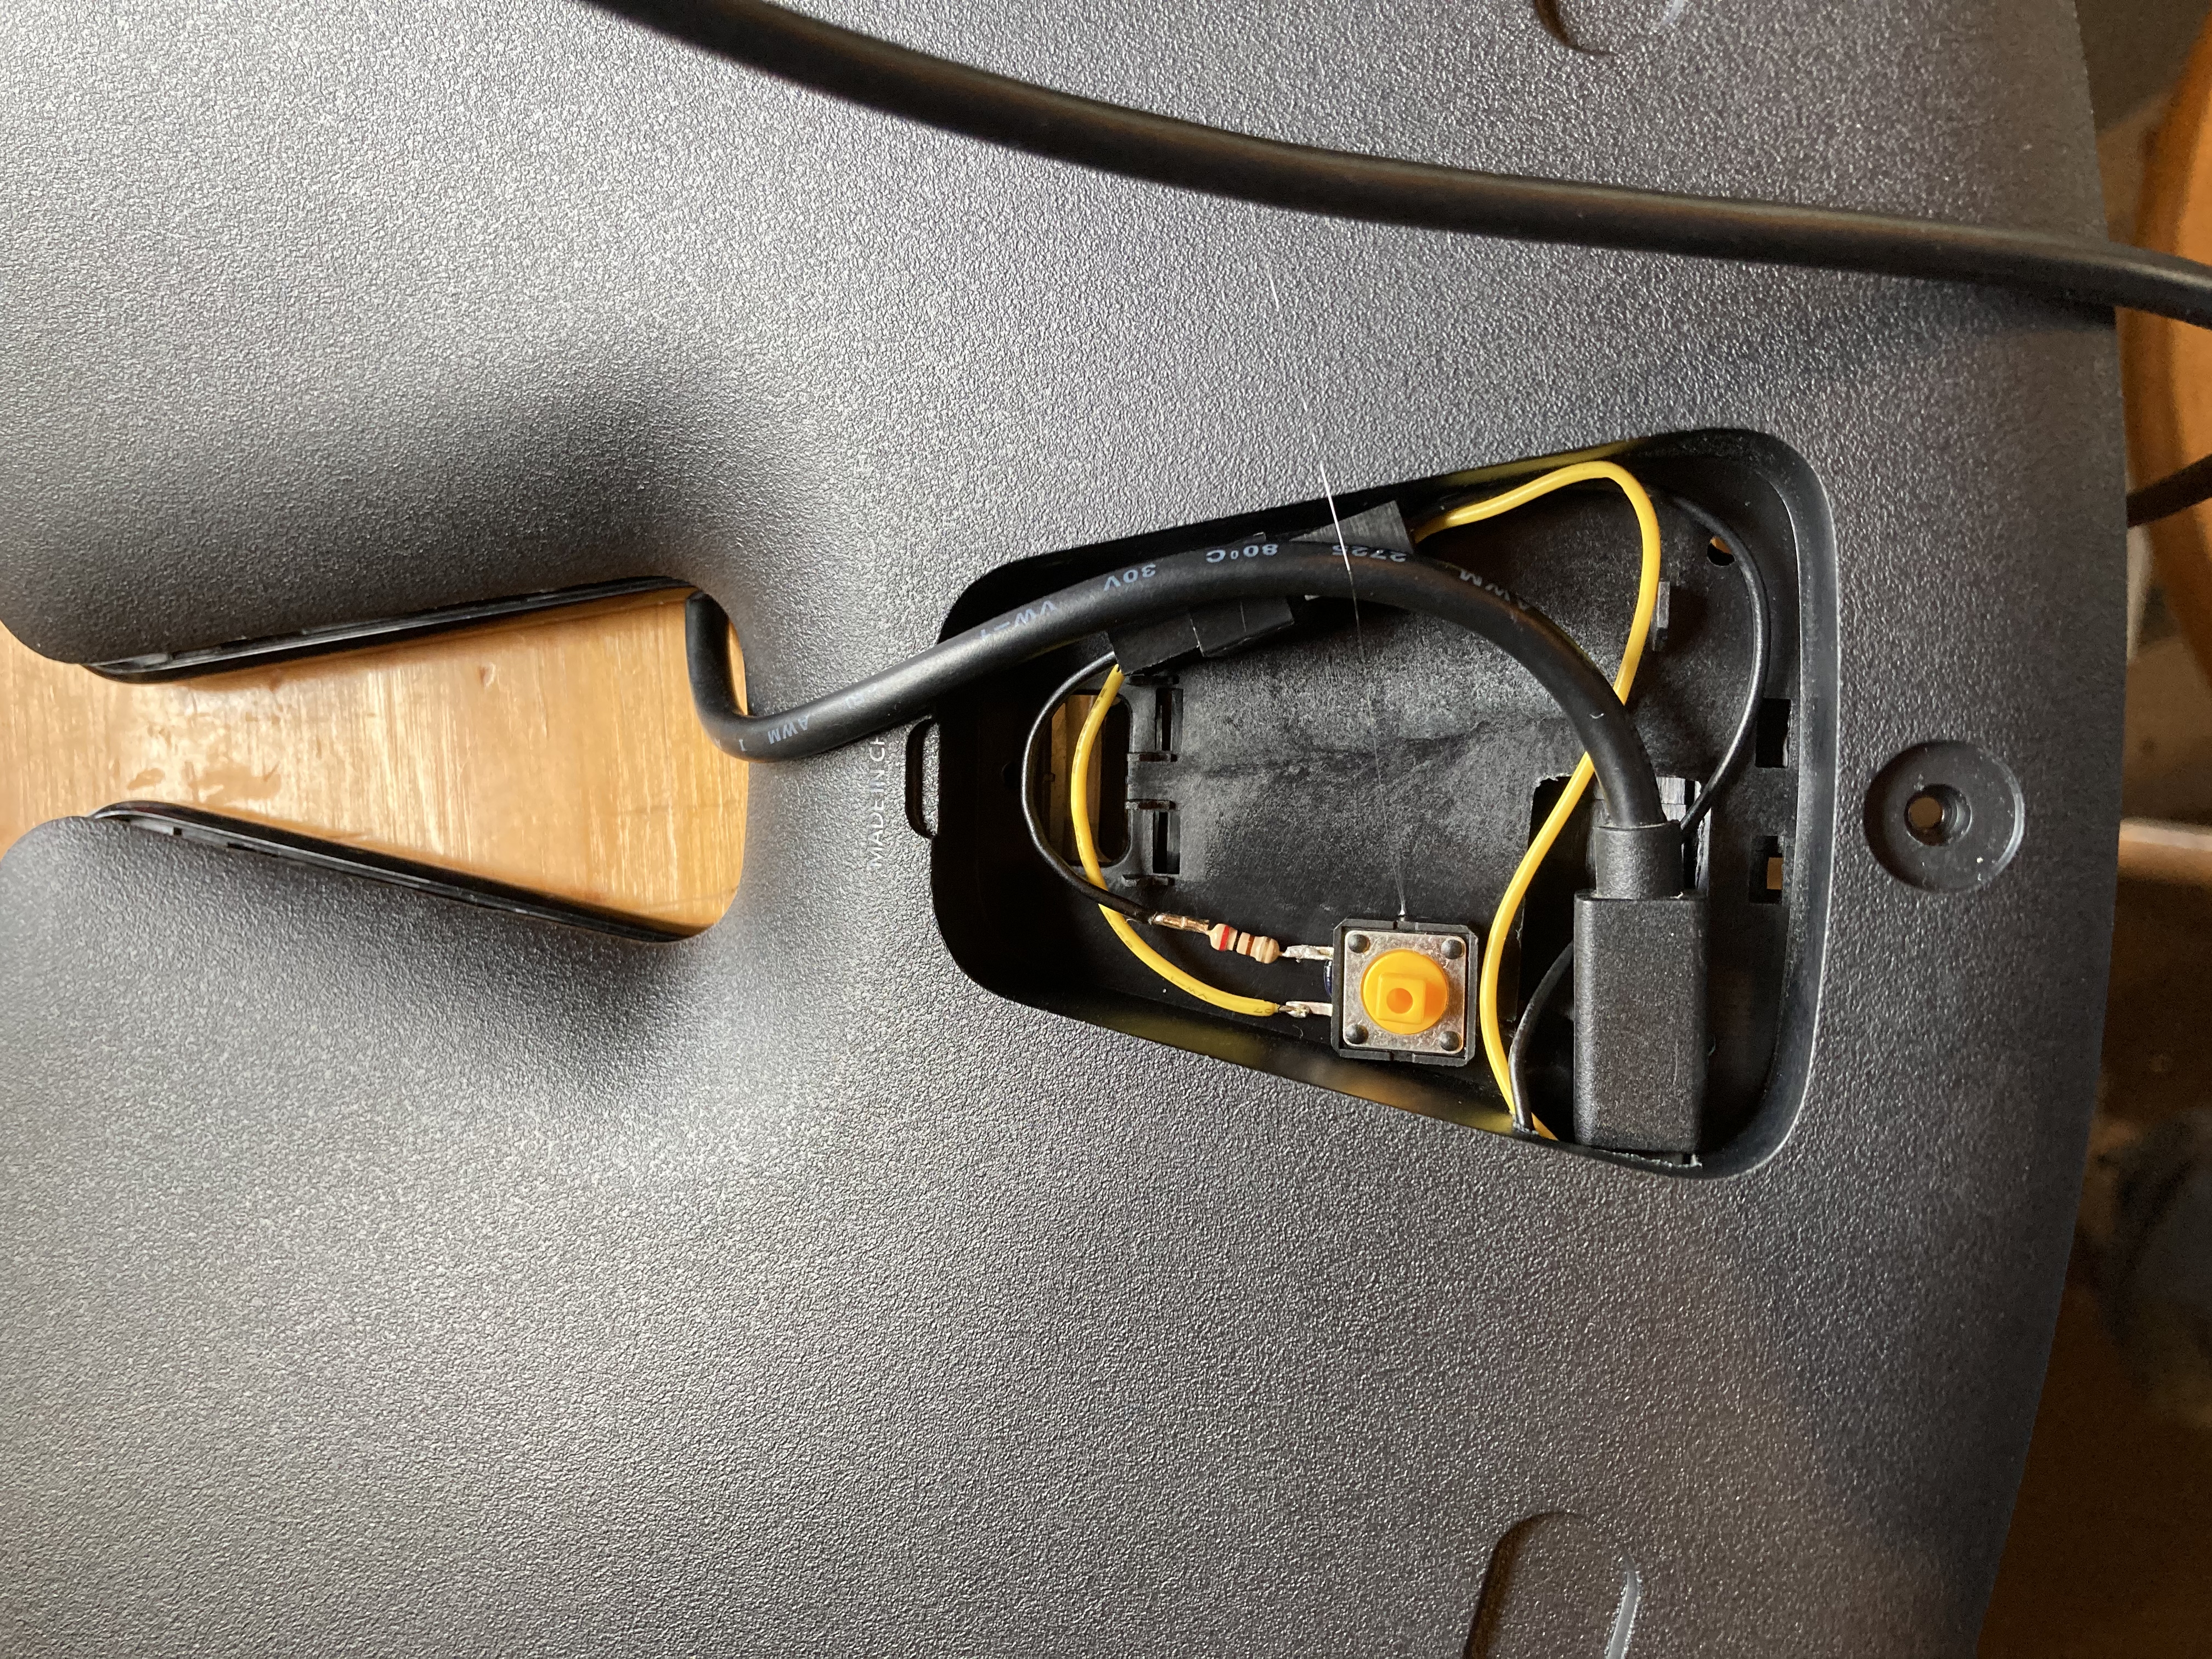
USB cable and reset button. The QMK config is available at @chadaustin/qmk_firmware (keyboards/handwired/sculpt/), and the PCB design files at @chadaustin/wired-sculpt-pcb.
I’m planning on making at least one more, so if you’d like one, maybe I can help.
It’s a huge improvement. Latency is reduced by about 13 milliseconds, and with full control over the microcontroller’s firmware, you can customize keymaps and layers, and actually use the keyboard’s built-in LEDs.
Why?
Feel free to stop reading here — I am going to tell the sequence of events that led to this project. Besides some exposure to basic voltage and resistance circuits in college, I have very little electronics background. But, in a short time, I went from only barely knowing what a capacitor was to having a working PCB manufactured and assembled, and maybe this will inspire someone else to give it a try.
Since developing RSI in college, I’ve exclusively used Microsoft’s ergonomic keyboards. And when I first tried the Sculpt, I instantly knew it was the best yet. The soft actuation, short key travel, and rigid frame are perfect for my hands. And because the number pad is a separate device, the distance to my mouse is shortened.
My brother went out and bought one too. Not much later, he gave it to me, saying the latency was inconsistent and high, and it was unacceptable for gaming. I thought he was being uniquely sensitive, since I had no problem in either Linux, Windows 7, or macOS. But then I updated to Windows 10 and saw exactly what he meant.
It was like the keyboard would go to sleep if a key wasn’t pressed for a few seconds, and the first keypress after a wake would be delayed or, worse, dropped.
And heaven forbid I use my USB 3 hub, whose EMI would disrupt the 2.4 GHz signal, and every other keypress would be unreliable. I’d gone as far as mounting the wireless transceiver directly under my keyboard, on the underside of my desk, and keys were still dropped.
So, best keyboard ever. But wireless sucks. (But mostly in Windows 10? No idea about that.)
Over the Hump
What started this whole thing is that the EdenFS team was a bunch of keyboard enthusiasts. During the pandemic, as we’re all at home burning out and missing each other, we were trying to think of some virtual team offsites. Wez offered to walk everyone through building a Sweet 16 Macro Pad.
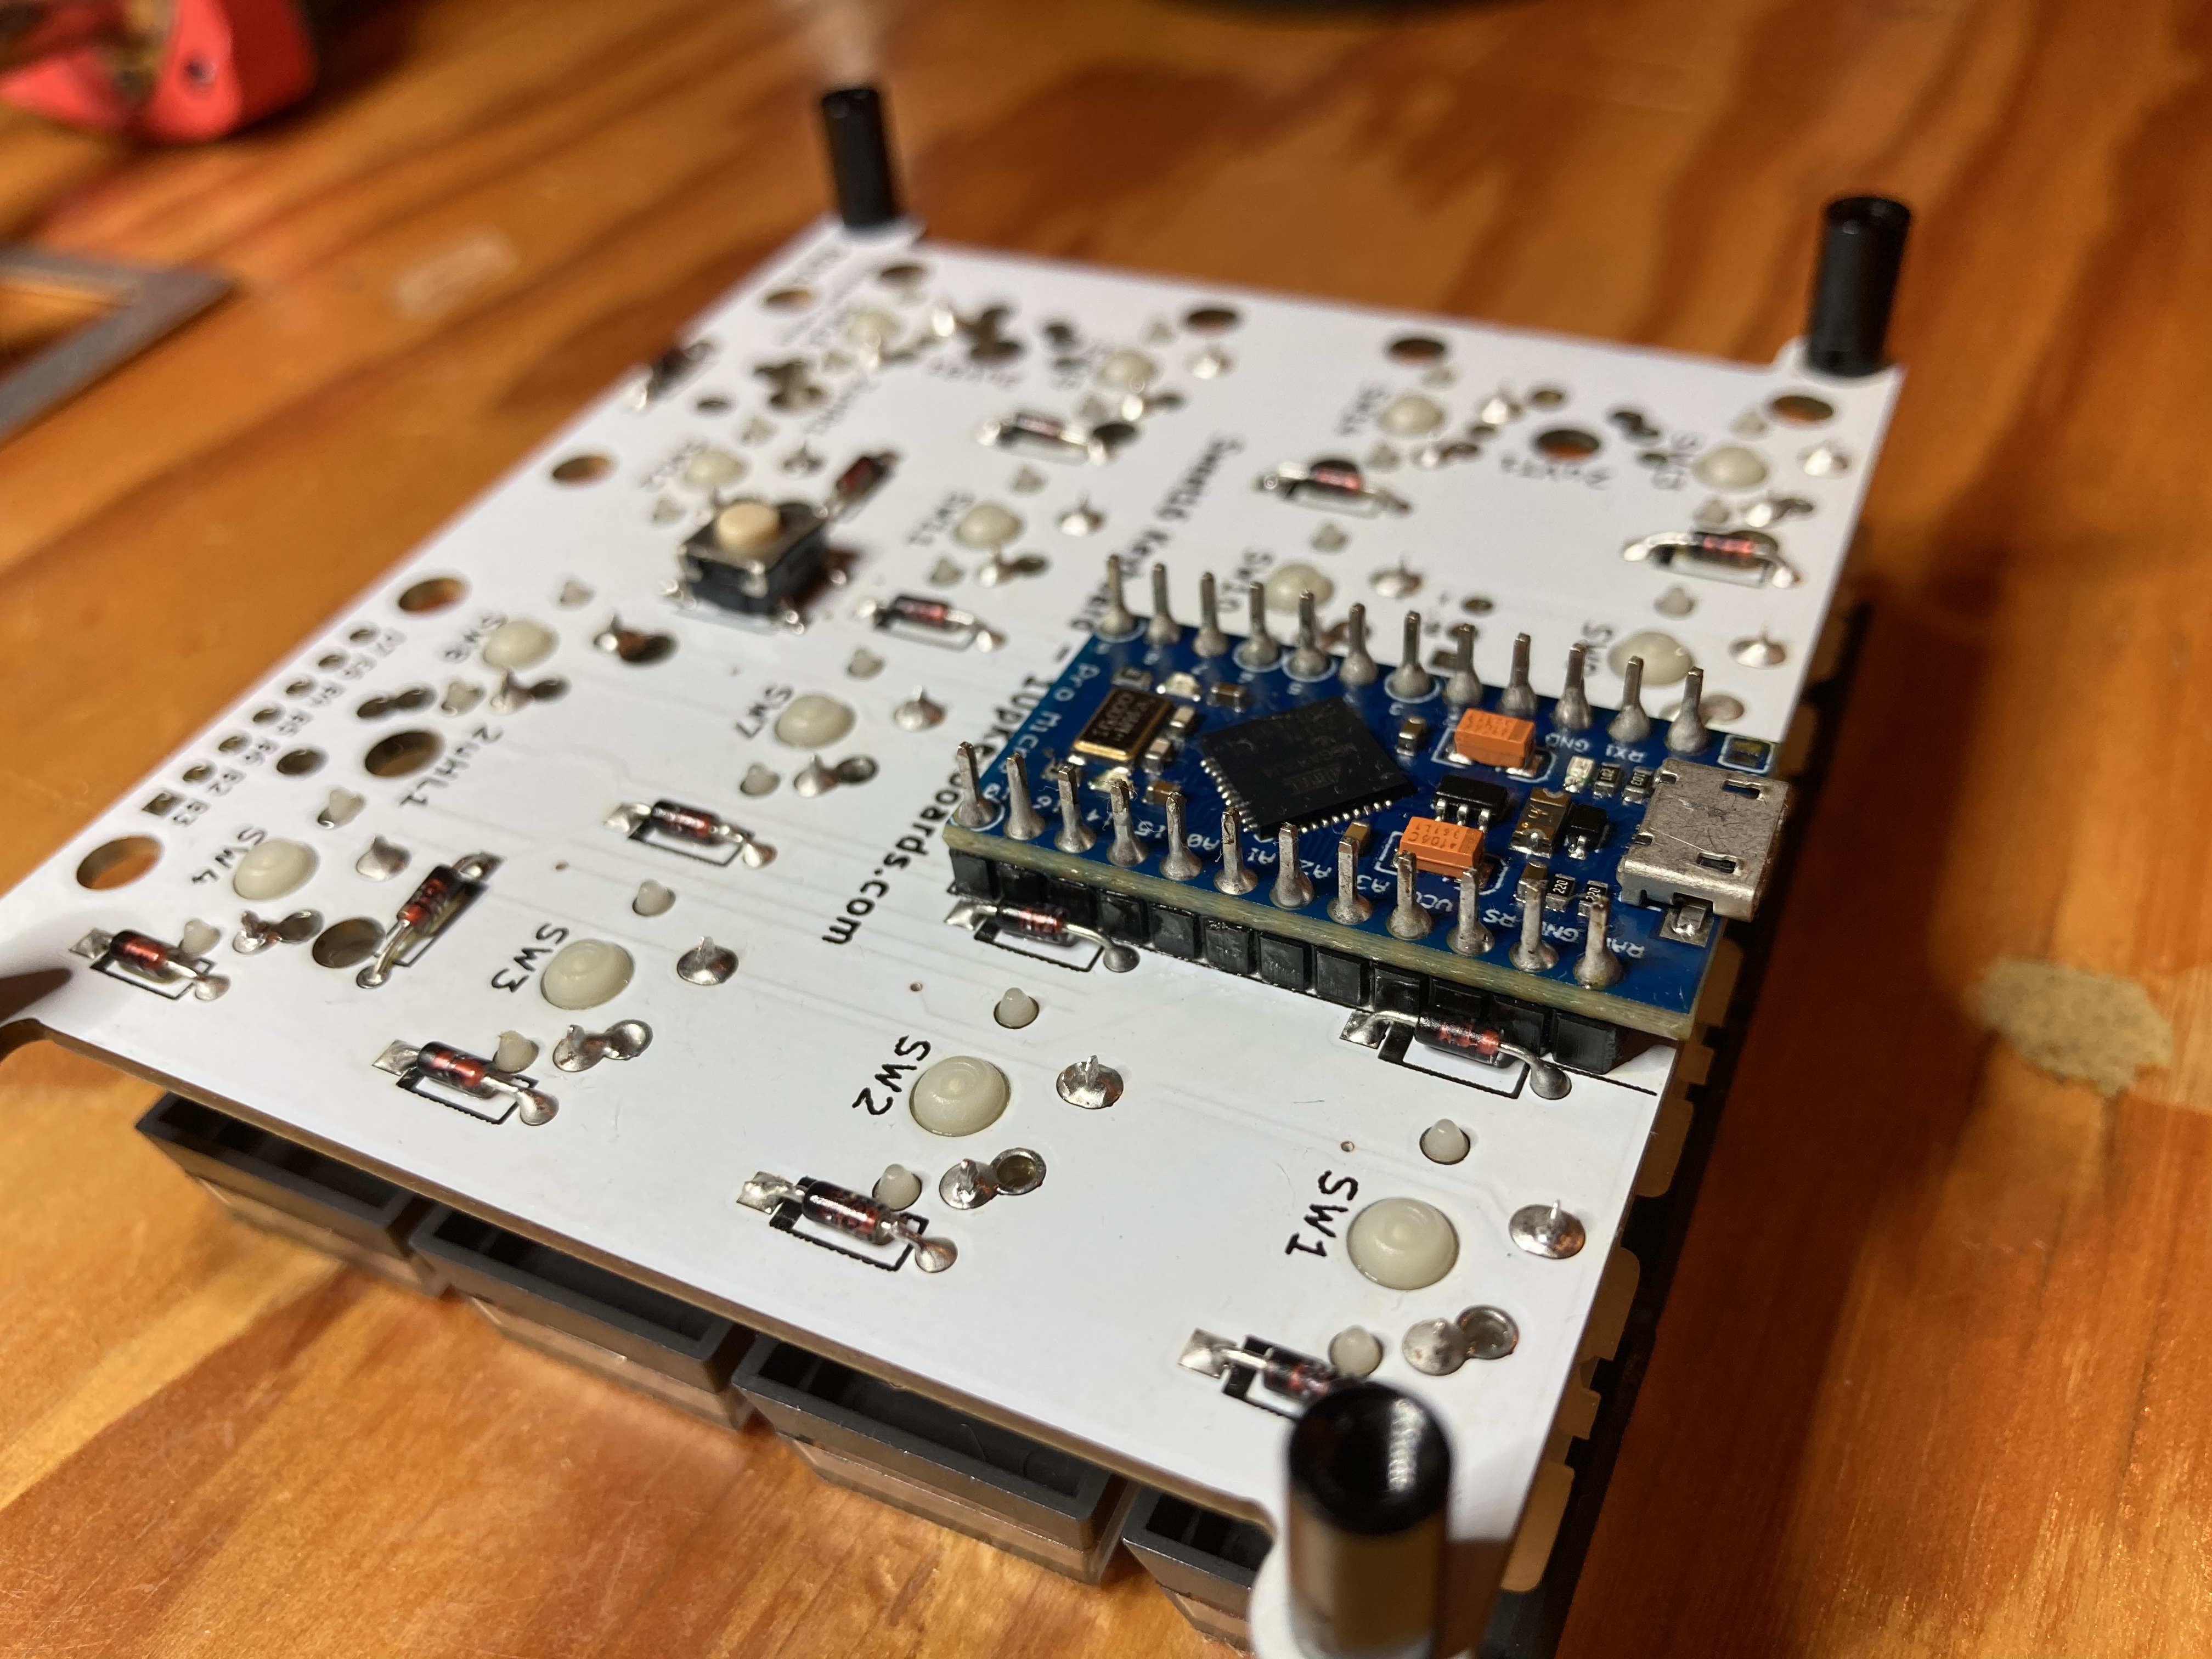
Assembled Sweet 16 underside. This is take two, after resoldering and cleaning the whole thing. Take one was a bit of a mess. So, okay, a keyboard is a matrix, with some diodes used to disambiguate the signalling, and a microcontroller that rapidly polls the matrix and reports events over USB…
So maybe I could fix the Sculpt! I bought a transceiver-less Sculpt off eBay for cheap and popped it open (thanks Emmanuel Contreras!), thinking maybe its controller could be flashed with new firmware that speaks USB. The Sculpt uses a Nordic Semiconductor nRF24LE1, but I was nowhere near capable of making use of that information at the time, though it did point me to Samy Kamkar’s horrifying guide on surreptitiously sniffing keystrokes from nearby (older) Microsoft wireless keyboards.
I almost gave up here, but Per Vognsen suggested I scan the matrix myself and it turns out Michael Fincham had already mapped out the matrix and soldered a Teensy 2.0++ board onto the Sculpt’s test pads, showing this was doable!
So I ordered my own microcontroller to try the same thing.
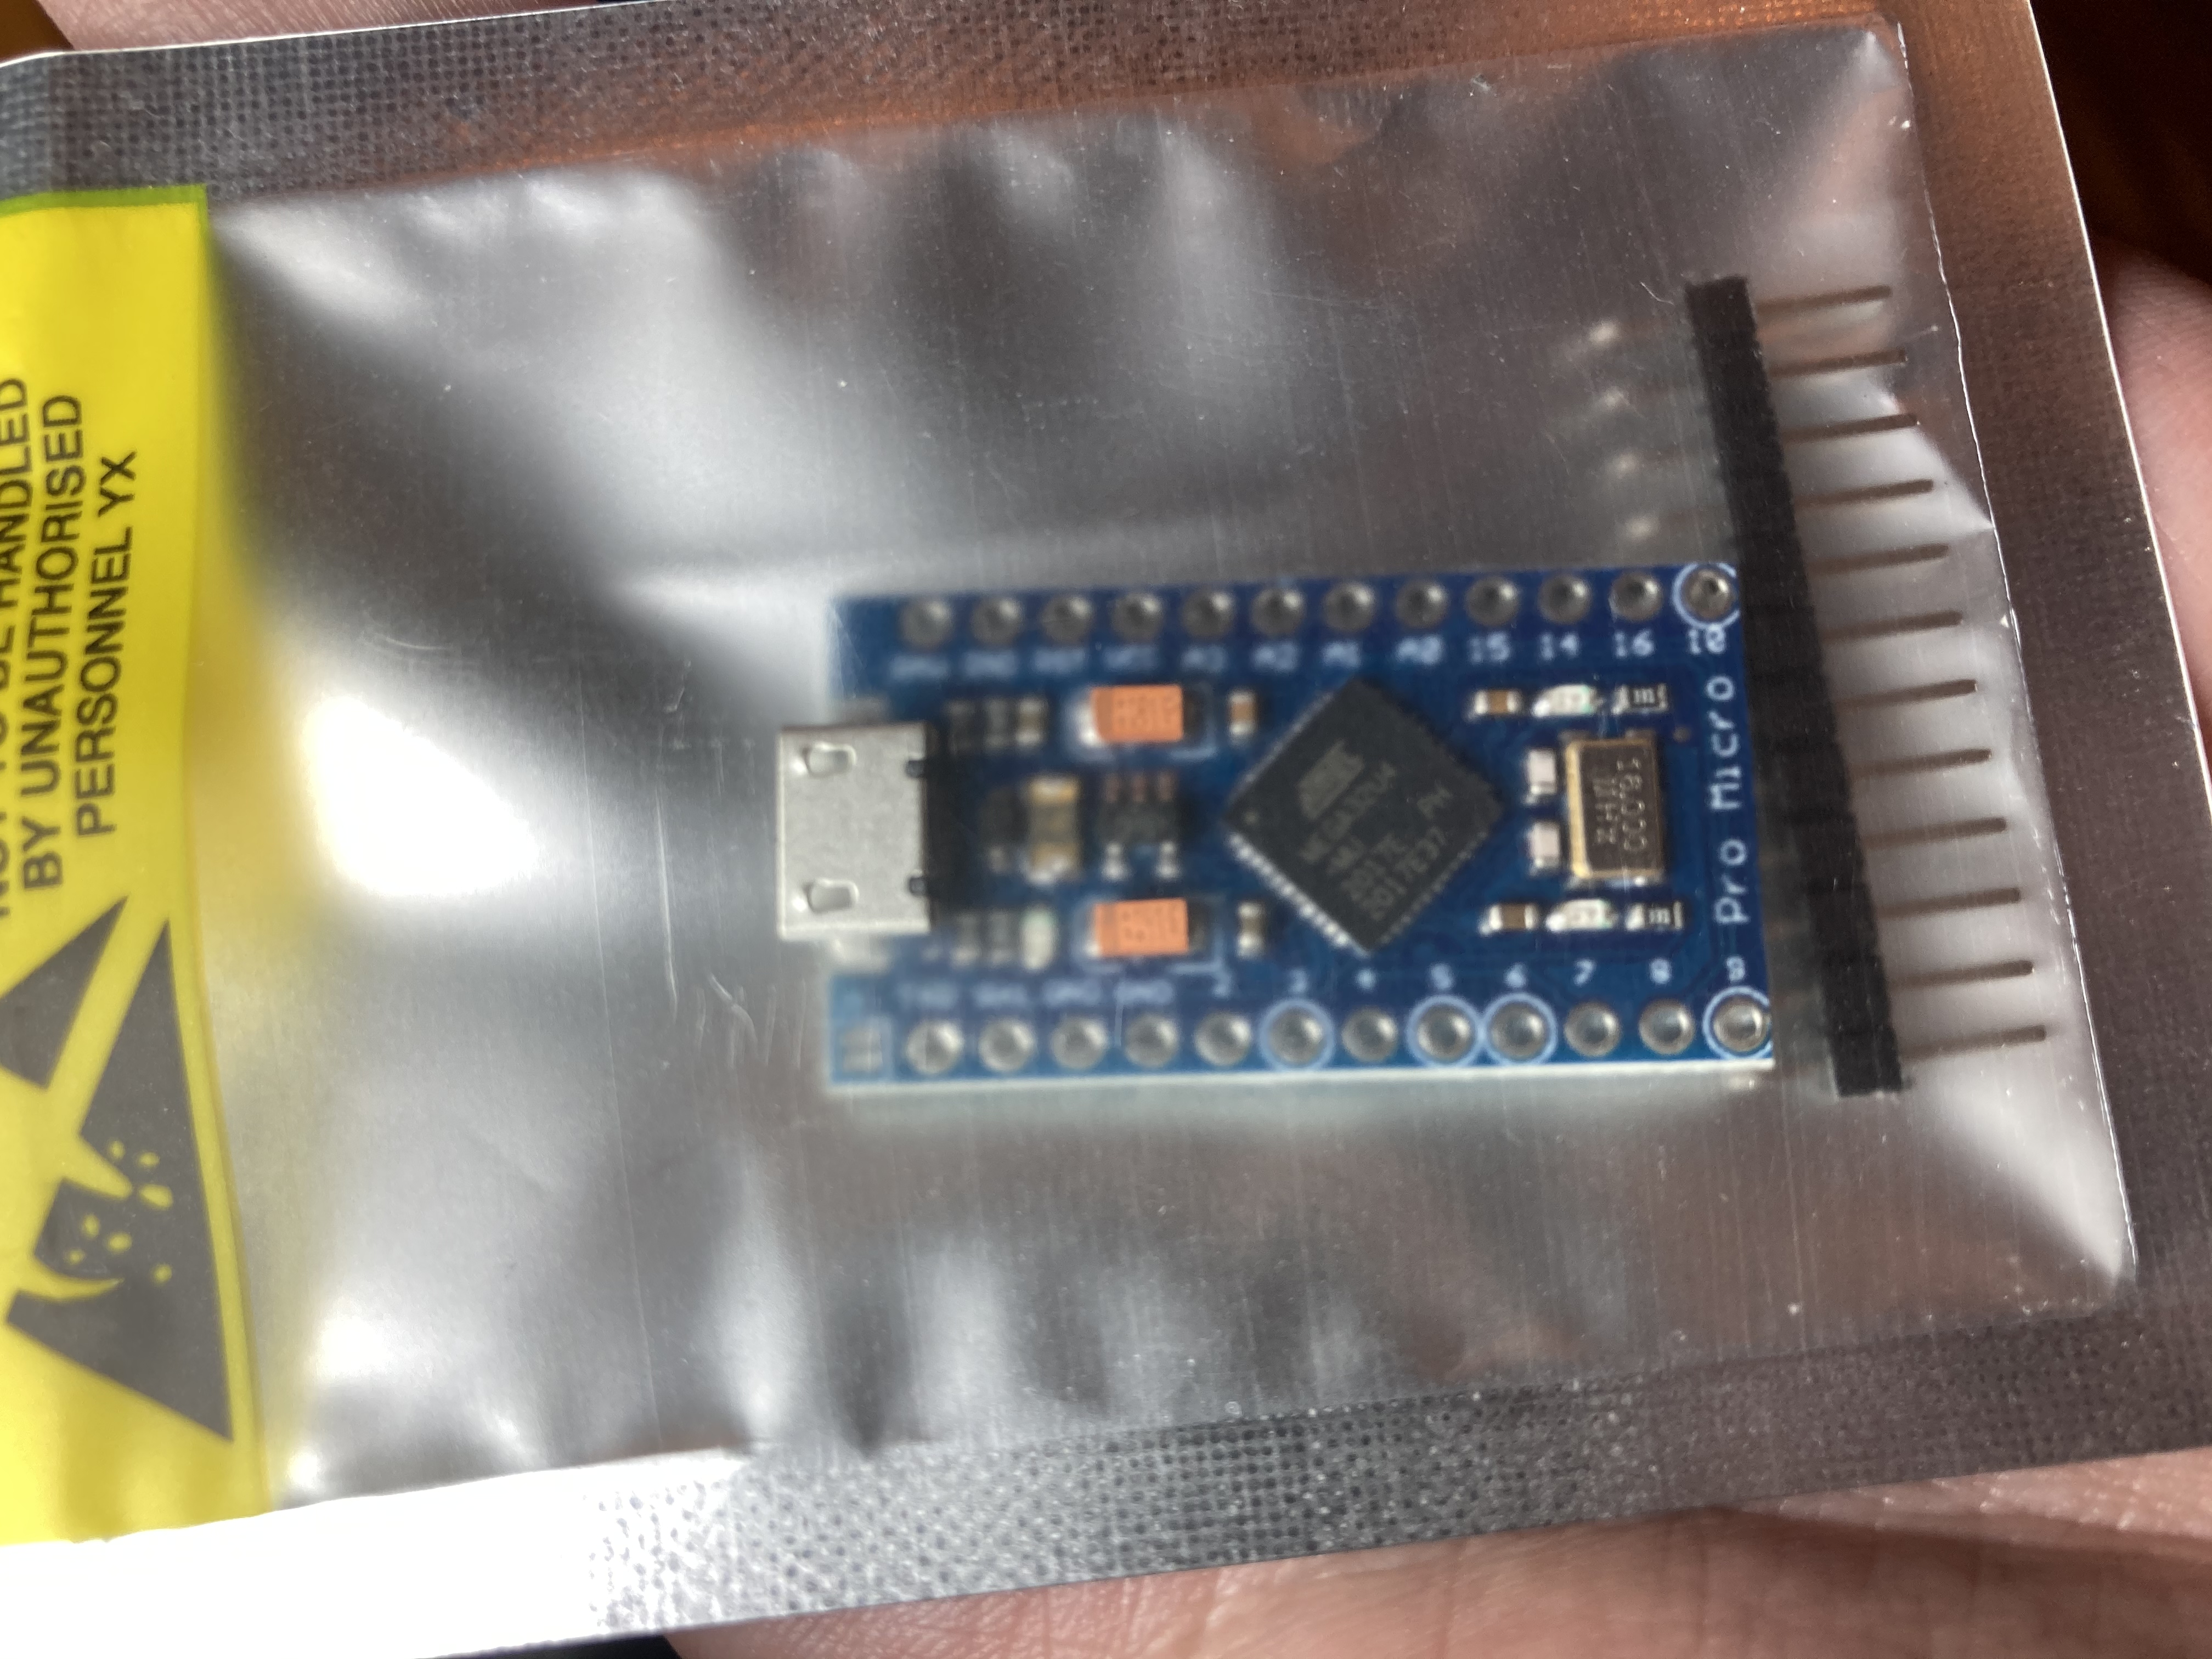
First, I bought an Arduino Pro Micro, like the Sweet 16 uses. Oh hey, 18 GPIO pins isn’t enough to drive the Sculpt’s 26-pin matrix. I looked at using an I2C GPIO expander, but it felt like taking on too much.
Arduino Pro Micro. Wait, you need pins to scan a matrix? More pins? QMK’s Proton C has more pins! So I carefully soldered onto the test pads as Michael had shown was possible… and it worked!
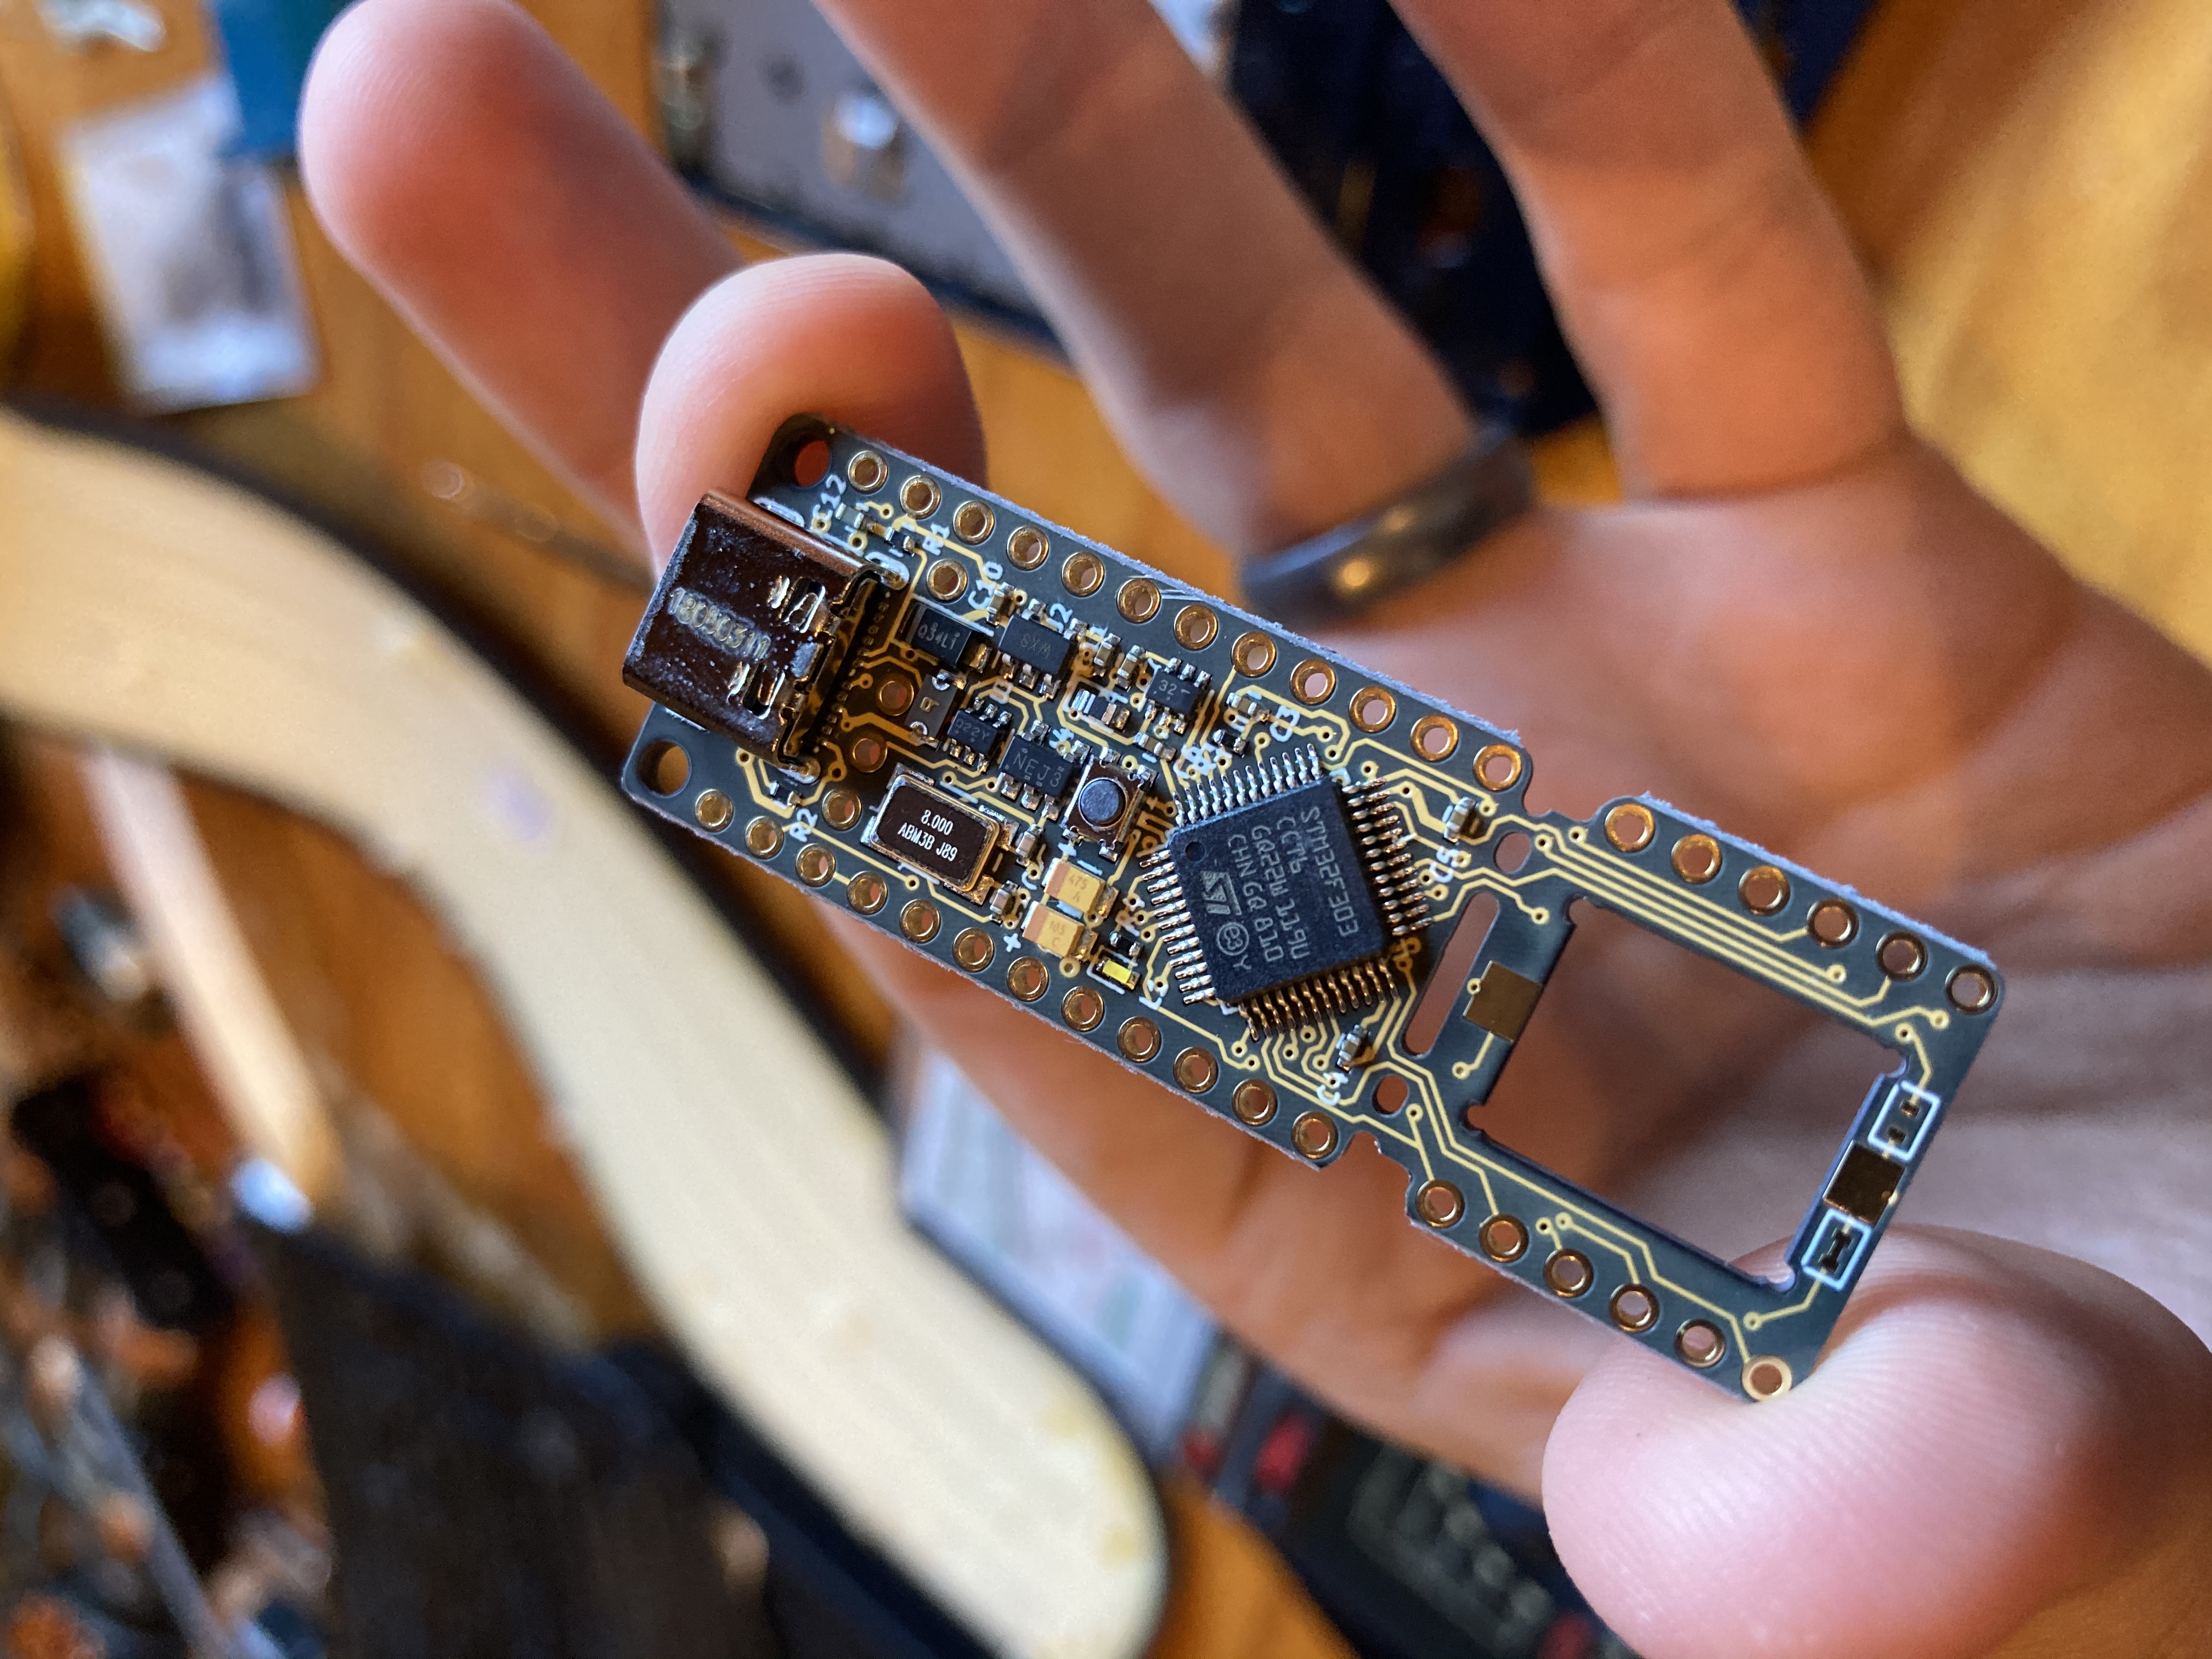
QMK Proton C. It's a beautiful board. 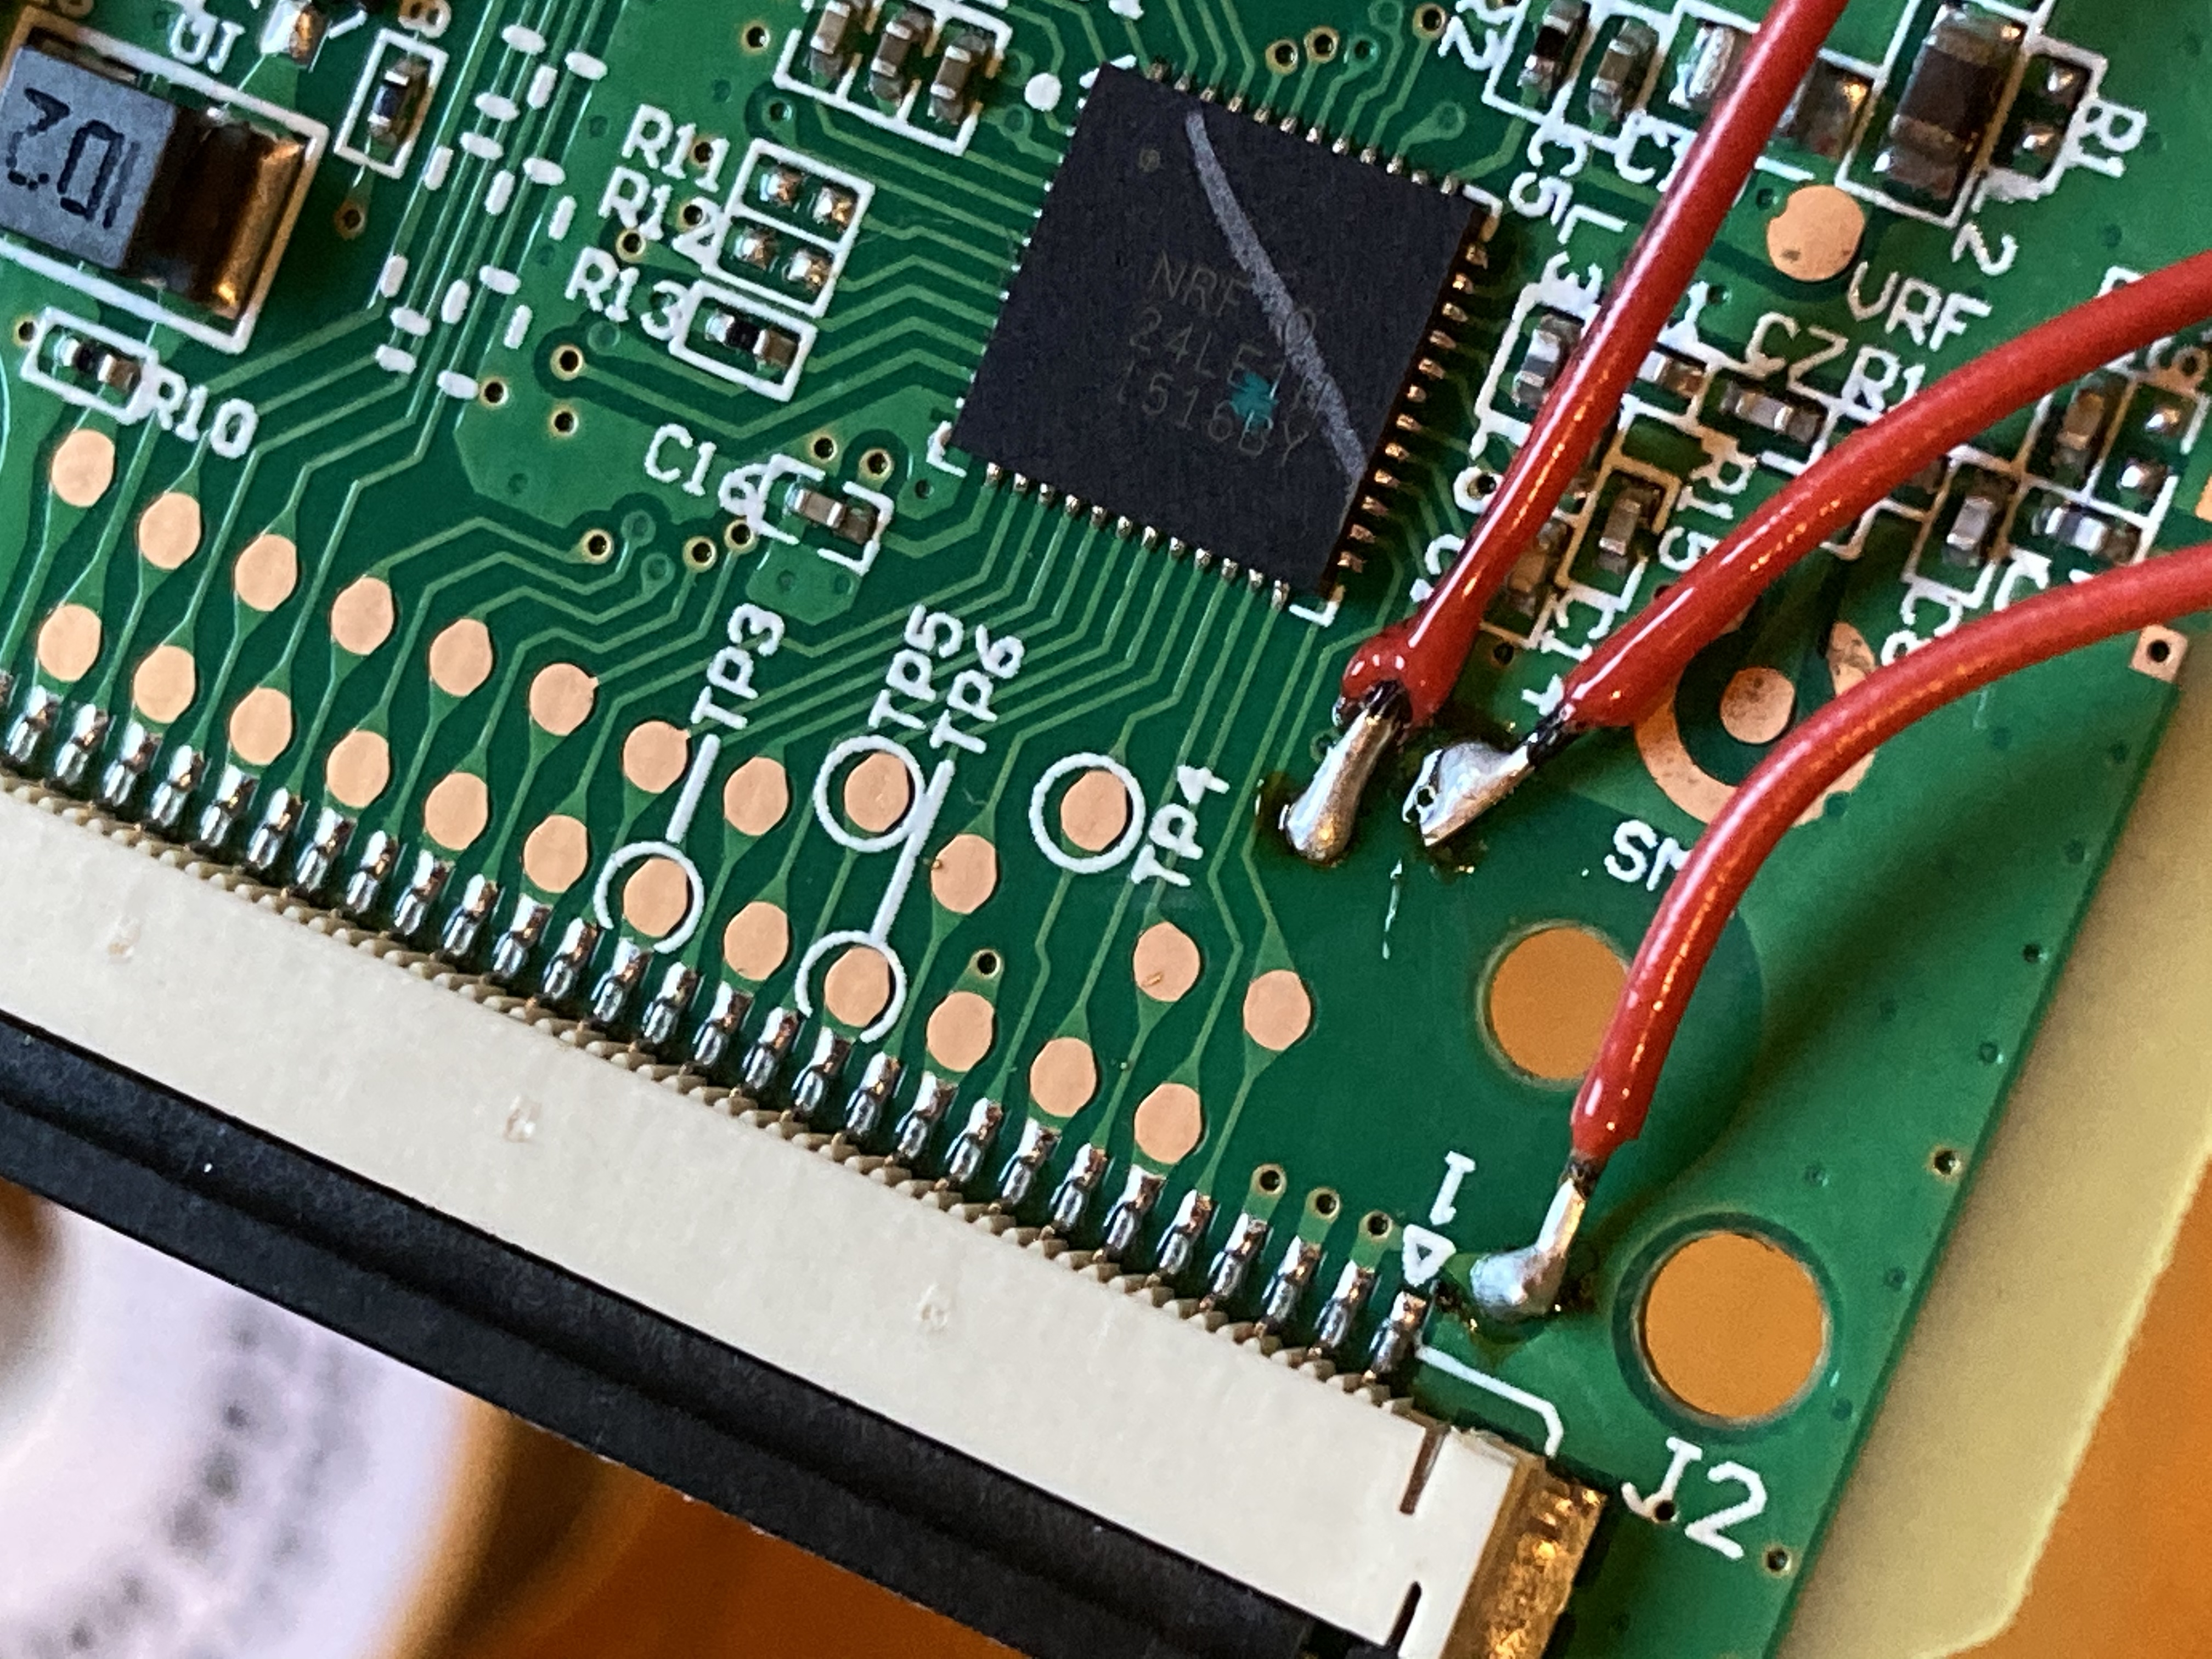
Soldering test pads to Proton C. 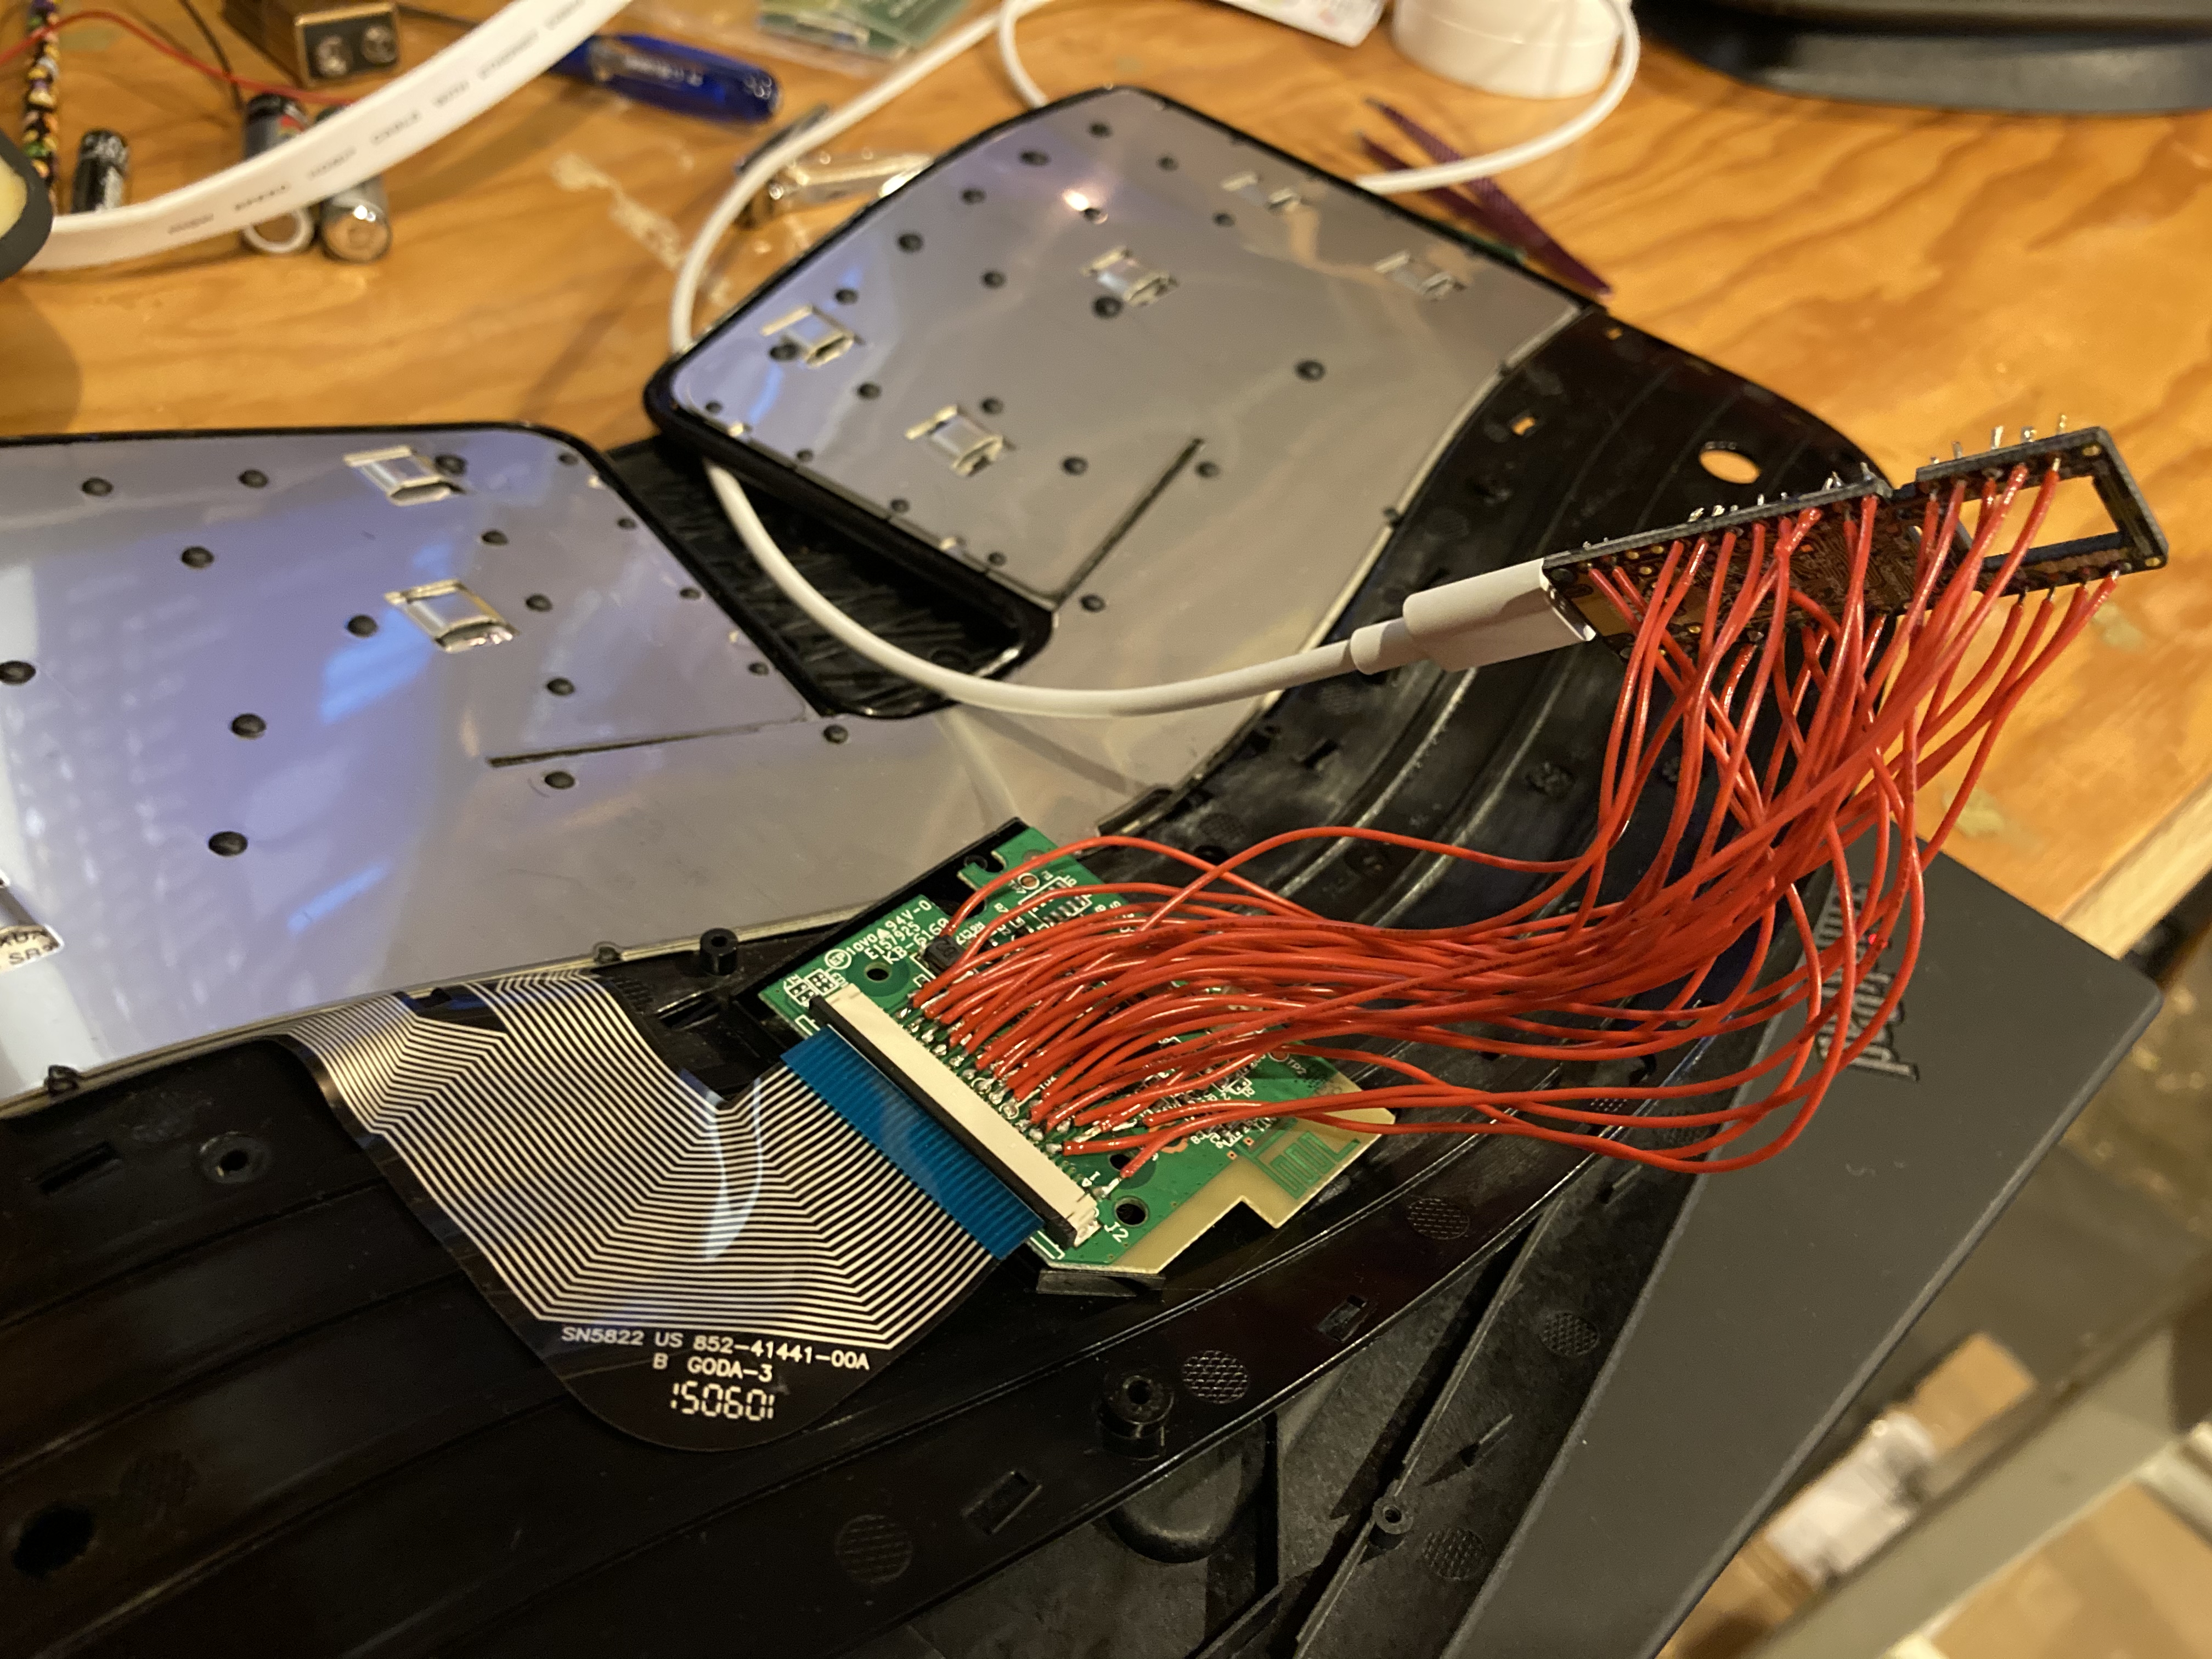
All test pads connected to Proton C. It works! Getting those wires to stick to the pads without shorting was tricky. (I hadn’t yet discovered how magical flux is.)
The keyboard worked, but I couldn’t fit the board, its wires, and the new microcontroller into the case, and I wasn’t really happy leaving it in this state, even if I could pack it in somehow.
I thought, all I really need is the ribbon cable connector, so I ordered a 30 pin, 1.0 mm pitch ribbon breakout and the pricier (but tons of pins!) Teensy 2.0++. Looking back, it’s cute that I was trying to save $10 on the microcontroller… You just have to get used to spending money on whatever saves you time.
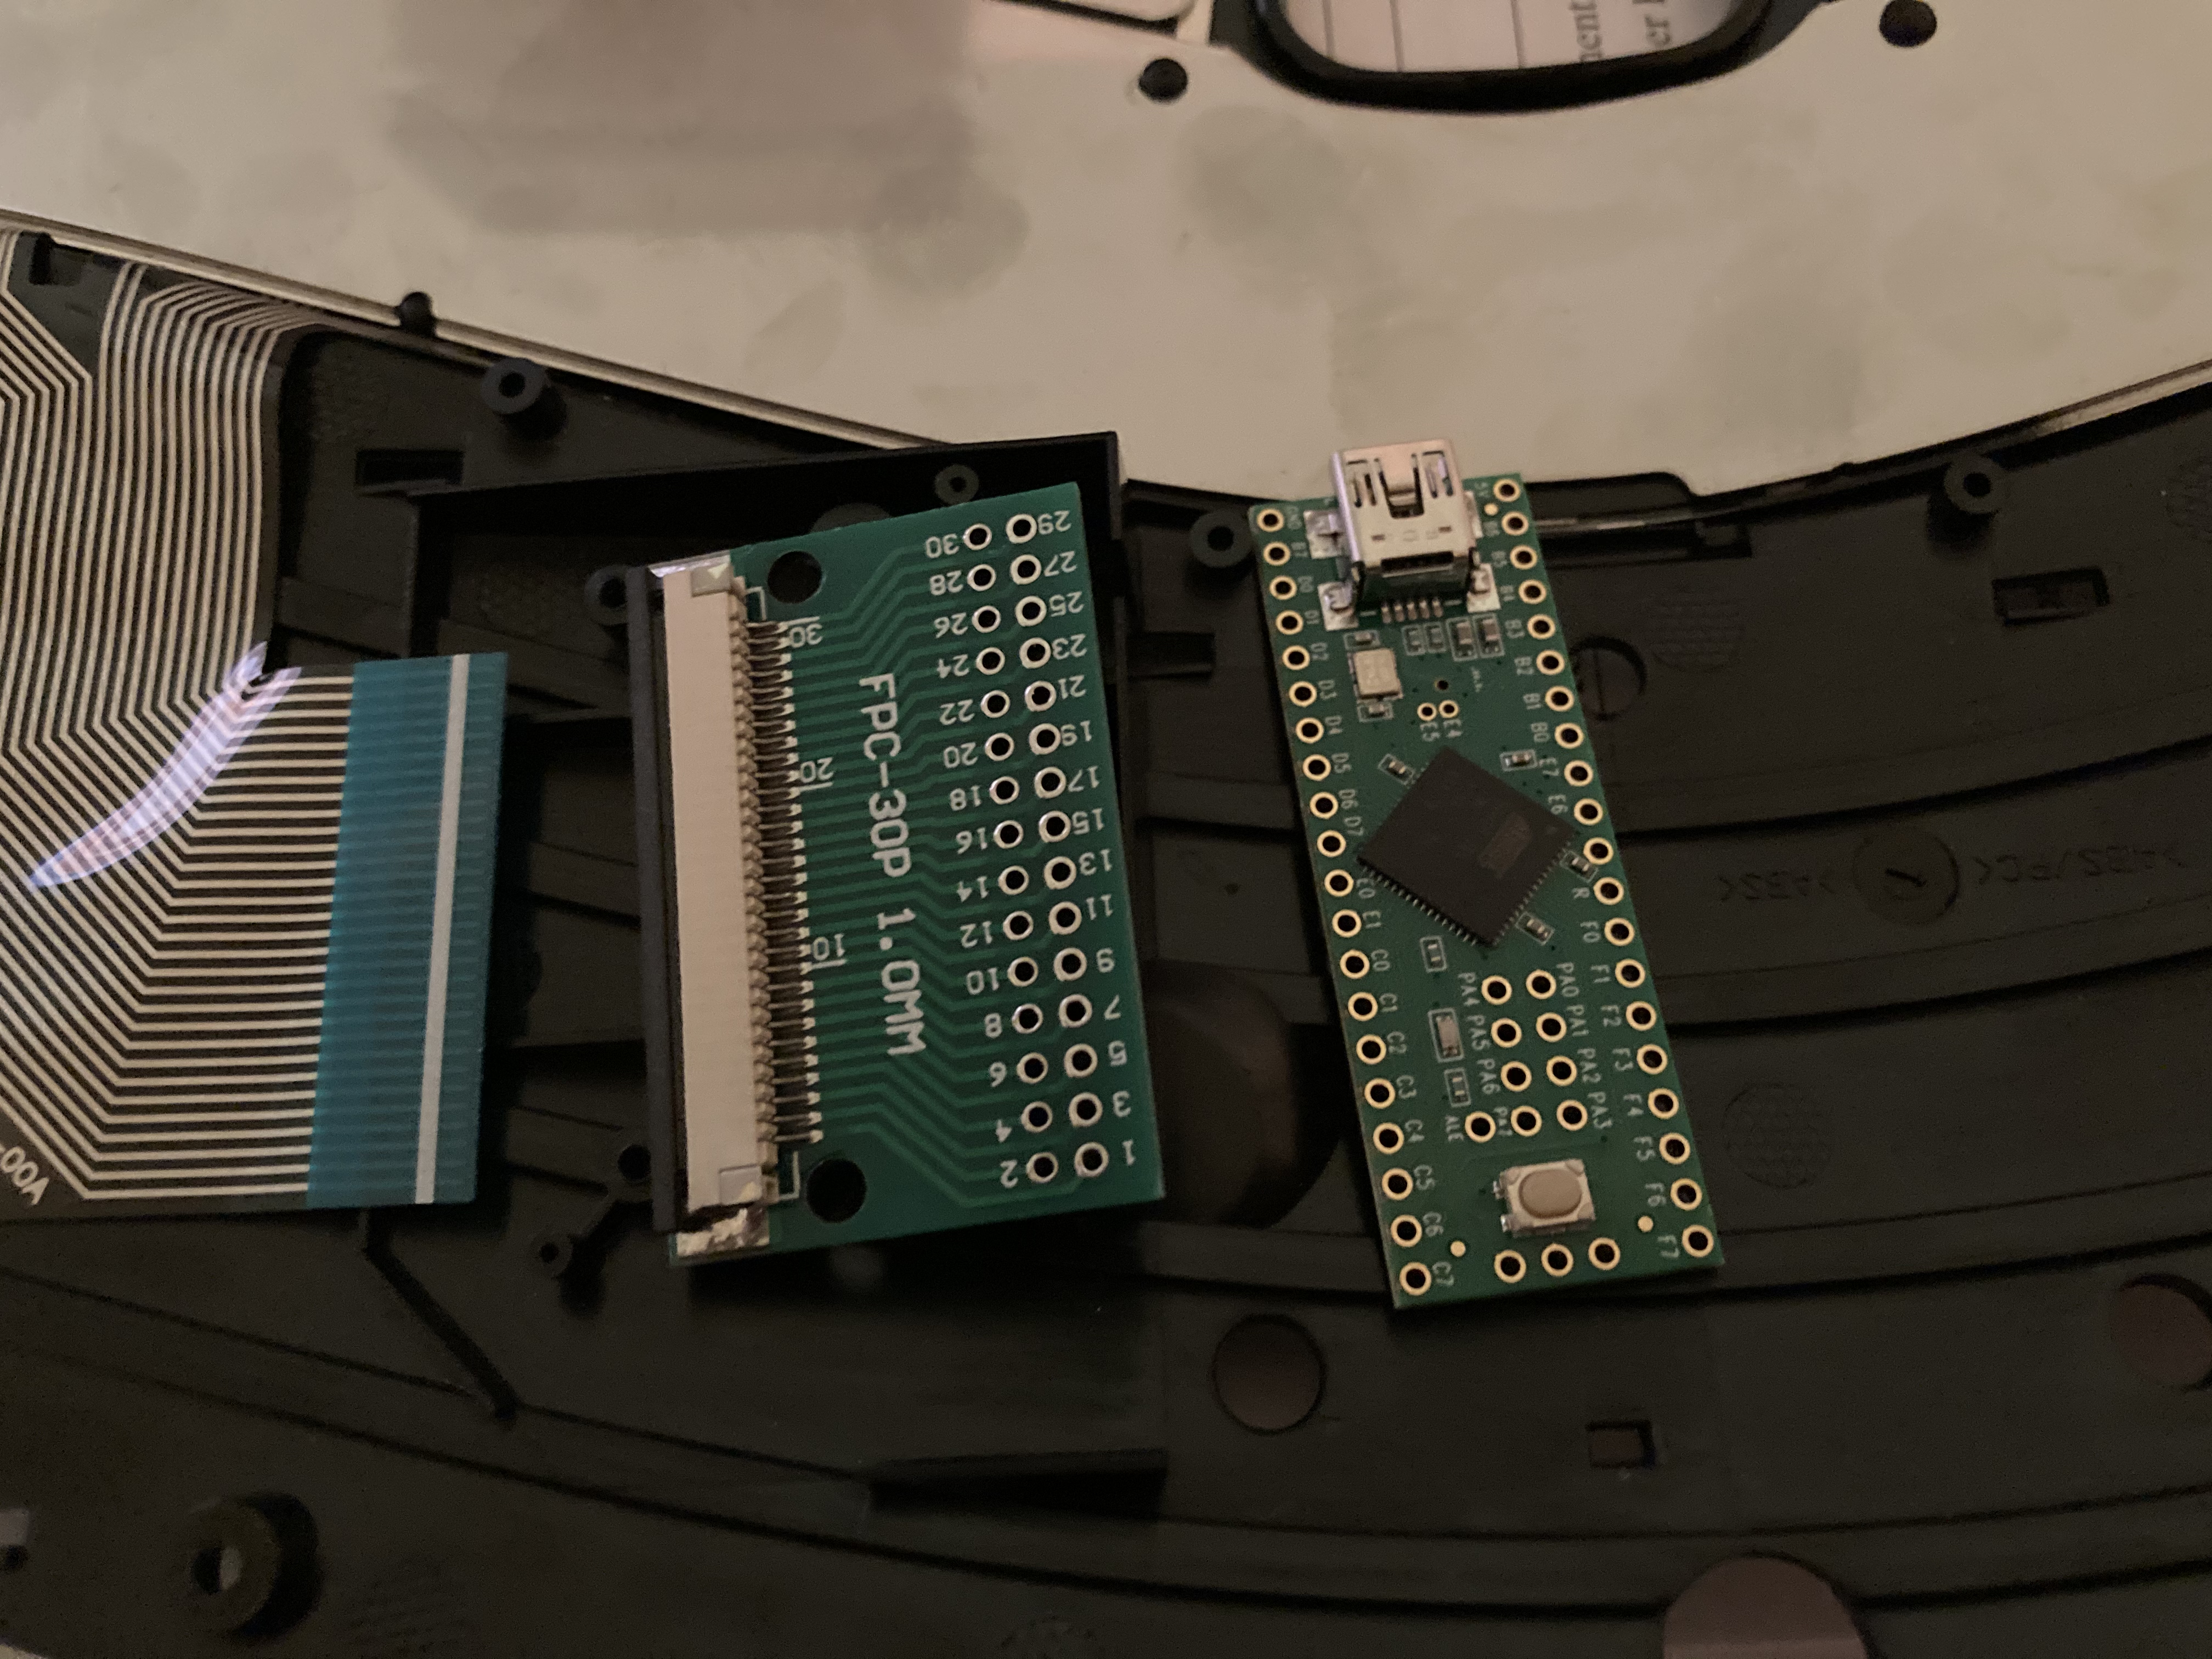
Ribbon cable breakout and Teensy 2.0++ Well, it was almost as annoying to solder, and still didn’t fit. So much for saving money on microcontrollers.
I thought about giving up. Is it really that bad that my keys don’t always register in games? Can I just tolerate some flakiness and latency?
But Jon Watte offered to spend an entire day showing me how to use KiCad, design circuits, layout PCBs, select components on Digi-Key, scan datasheets for the important information, and how to work with a PCB manufacturing house. Of course you never turn down opportunities like that.
Designing the Final Board - Schematic
Assuming, like me, you’ve never done this, I’ll summarize the steps.
First you sketch out the circuit schematic.
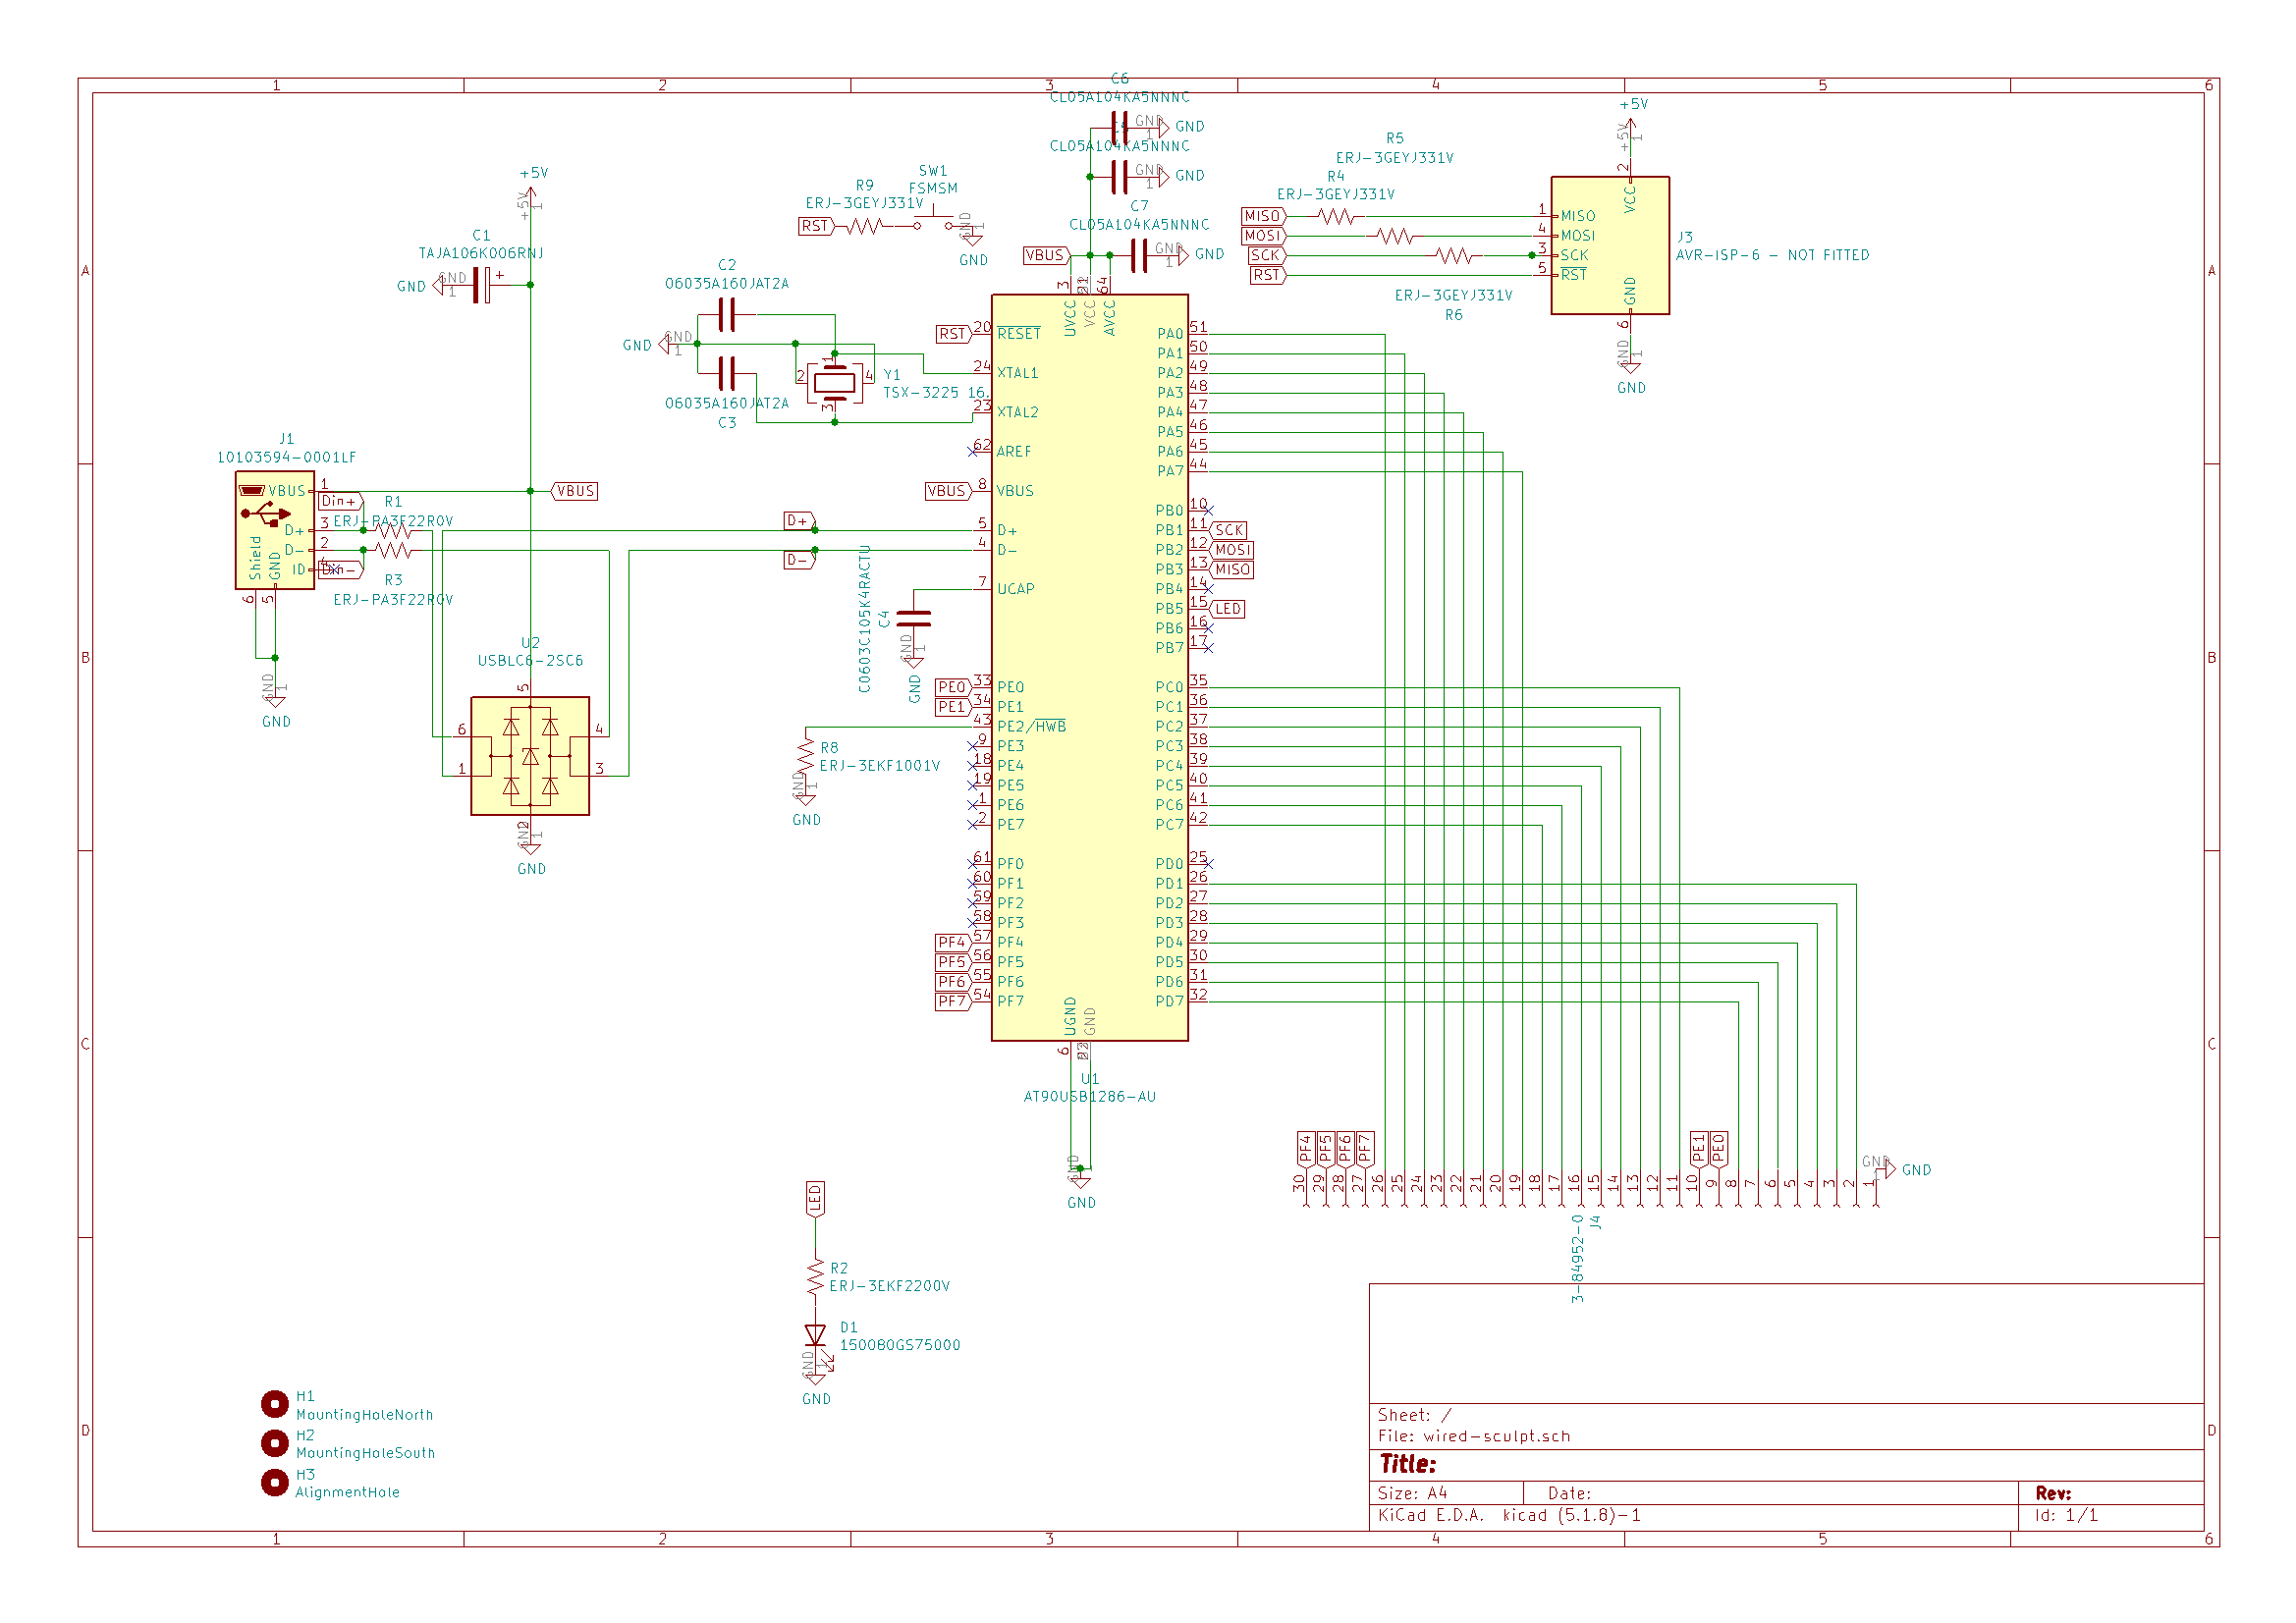
Schematic in KiCad. Most of this was informed by the datasheet and Atmel's design guides. Jon showed me several tricks in KiCad, like global labels, and starting with some standard resistor and capacitor values, but it’s very important that you go through the datasheets, because details can matter a ton.
I knew I wanted the main processor to be the AT90USB1286 controller, and fortunately KiCad already had a symbol for it. Atmel has a comprehensive and accessible data sheet, which showed me I needed some 22 Ω resistors on the USB data lines, which of the ISP programmer lines needed resistors (and appropriate values), and that I needed to either pull HWB low, or provide a physical switch that pulls it low, in order to allow rebooting the device into USB firmware update mode.
There are a bunch of things that are implicitly known to electrical engineers but that were new to me. You want:
- a ground plane under the data lines and most of the microcontroller if possible.
- an electrolytic or tantalum bypass capacitor on the main 5V power from USB.
- ceramic filter capacitors on each power pin.
- appropriate values for the resonance capacitors on your crystal.
- electrostatic discharge protection! Turns out transients are common and it’s easy to fry a chip just by plugging it in.
And then when you get into concerns like EMI and high-frequency signal integrity, the rabbit hole goes deep.
I kept having to tell myself “it’s just a keyboard”, but it also helped that there are a great number of high-quality resources on these topics just a click away. I spent lots of time on EEVBlog.
Before finishing the circuit design, Jon had me do a couple smart things. In case the factory-supplied USB bootloader didn’t work out, he suggested I add the footprint (but not a connector!) for an ISP programmer and a debug LED to prove code would work at all.
Designing the Final Board - Physical Layout
After arranging the schematic and ensuring it passed the electrical rules check, it was time to pick specific components. That is, the reference to a 220 Ω resistor is replaced with the Panasonic ERJ-3EKF2200V, 0603 surface mount.
There are a couple things to keep in mind. For common components, like resistors and ceramic capacitors, there is a huge amount of choice. For example, I see over 1400 surface-mount 220 Ω resistors on digikey. I tried to just stick with one high-quality brand like Panasonic or Samsung for all of that stuff.
The important thing is the physical form factor, which determines the footprint on the board. Once you pick a part, it has a size, and you need to tell KiCad which physical footprint should be assigned to that component. I used 0603 resistors, so I assigned each resistor in the schematic the “Resistor_SMD:R_0603_1608Metric” footprint.
Same for everything else. Jon showed me how to draw my own footprints, but to avoid complexity, I was able to find appropriate footprints in KiCad’s standard libraries for every component I needed.
When you import the schematic into Pcbnew, it’s time to figure out where things go. Where are the edges of the board? Make careful measurements here. Where do the mounting holes go? Where do you want the microcontroller? Where do you want the USB port?
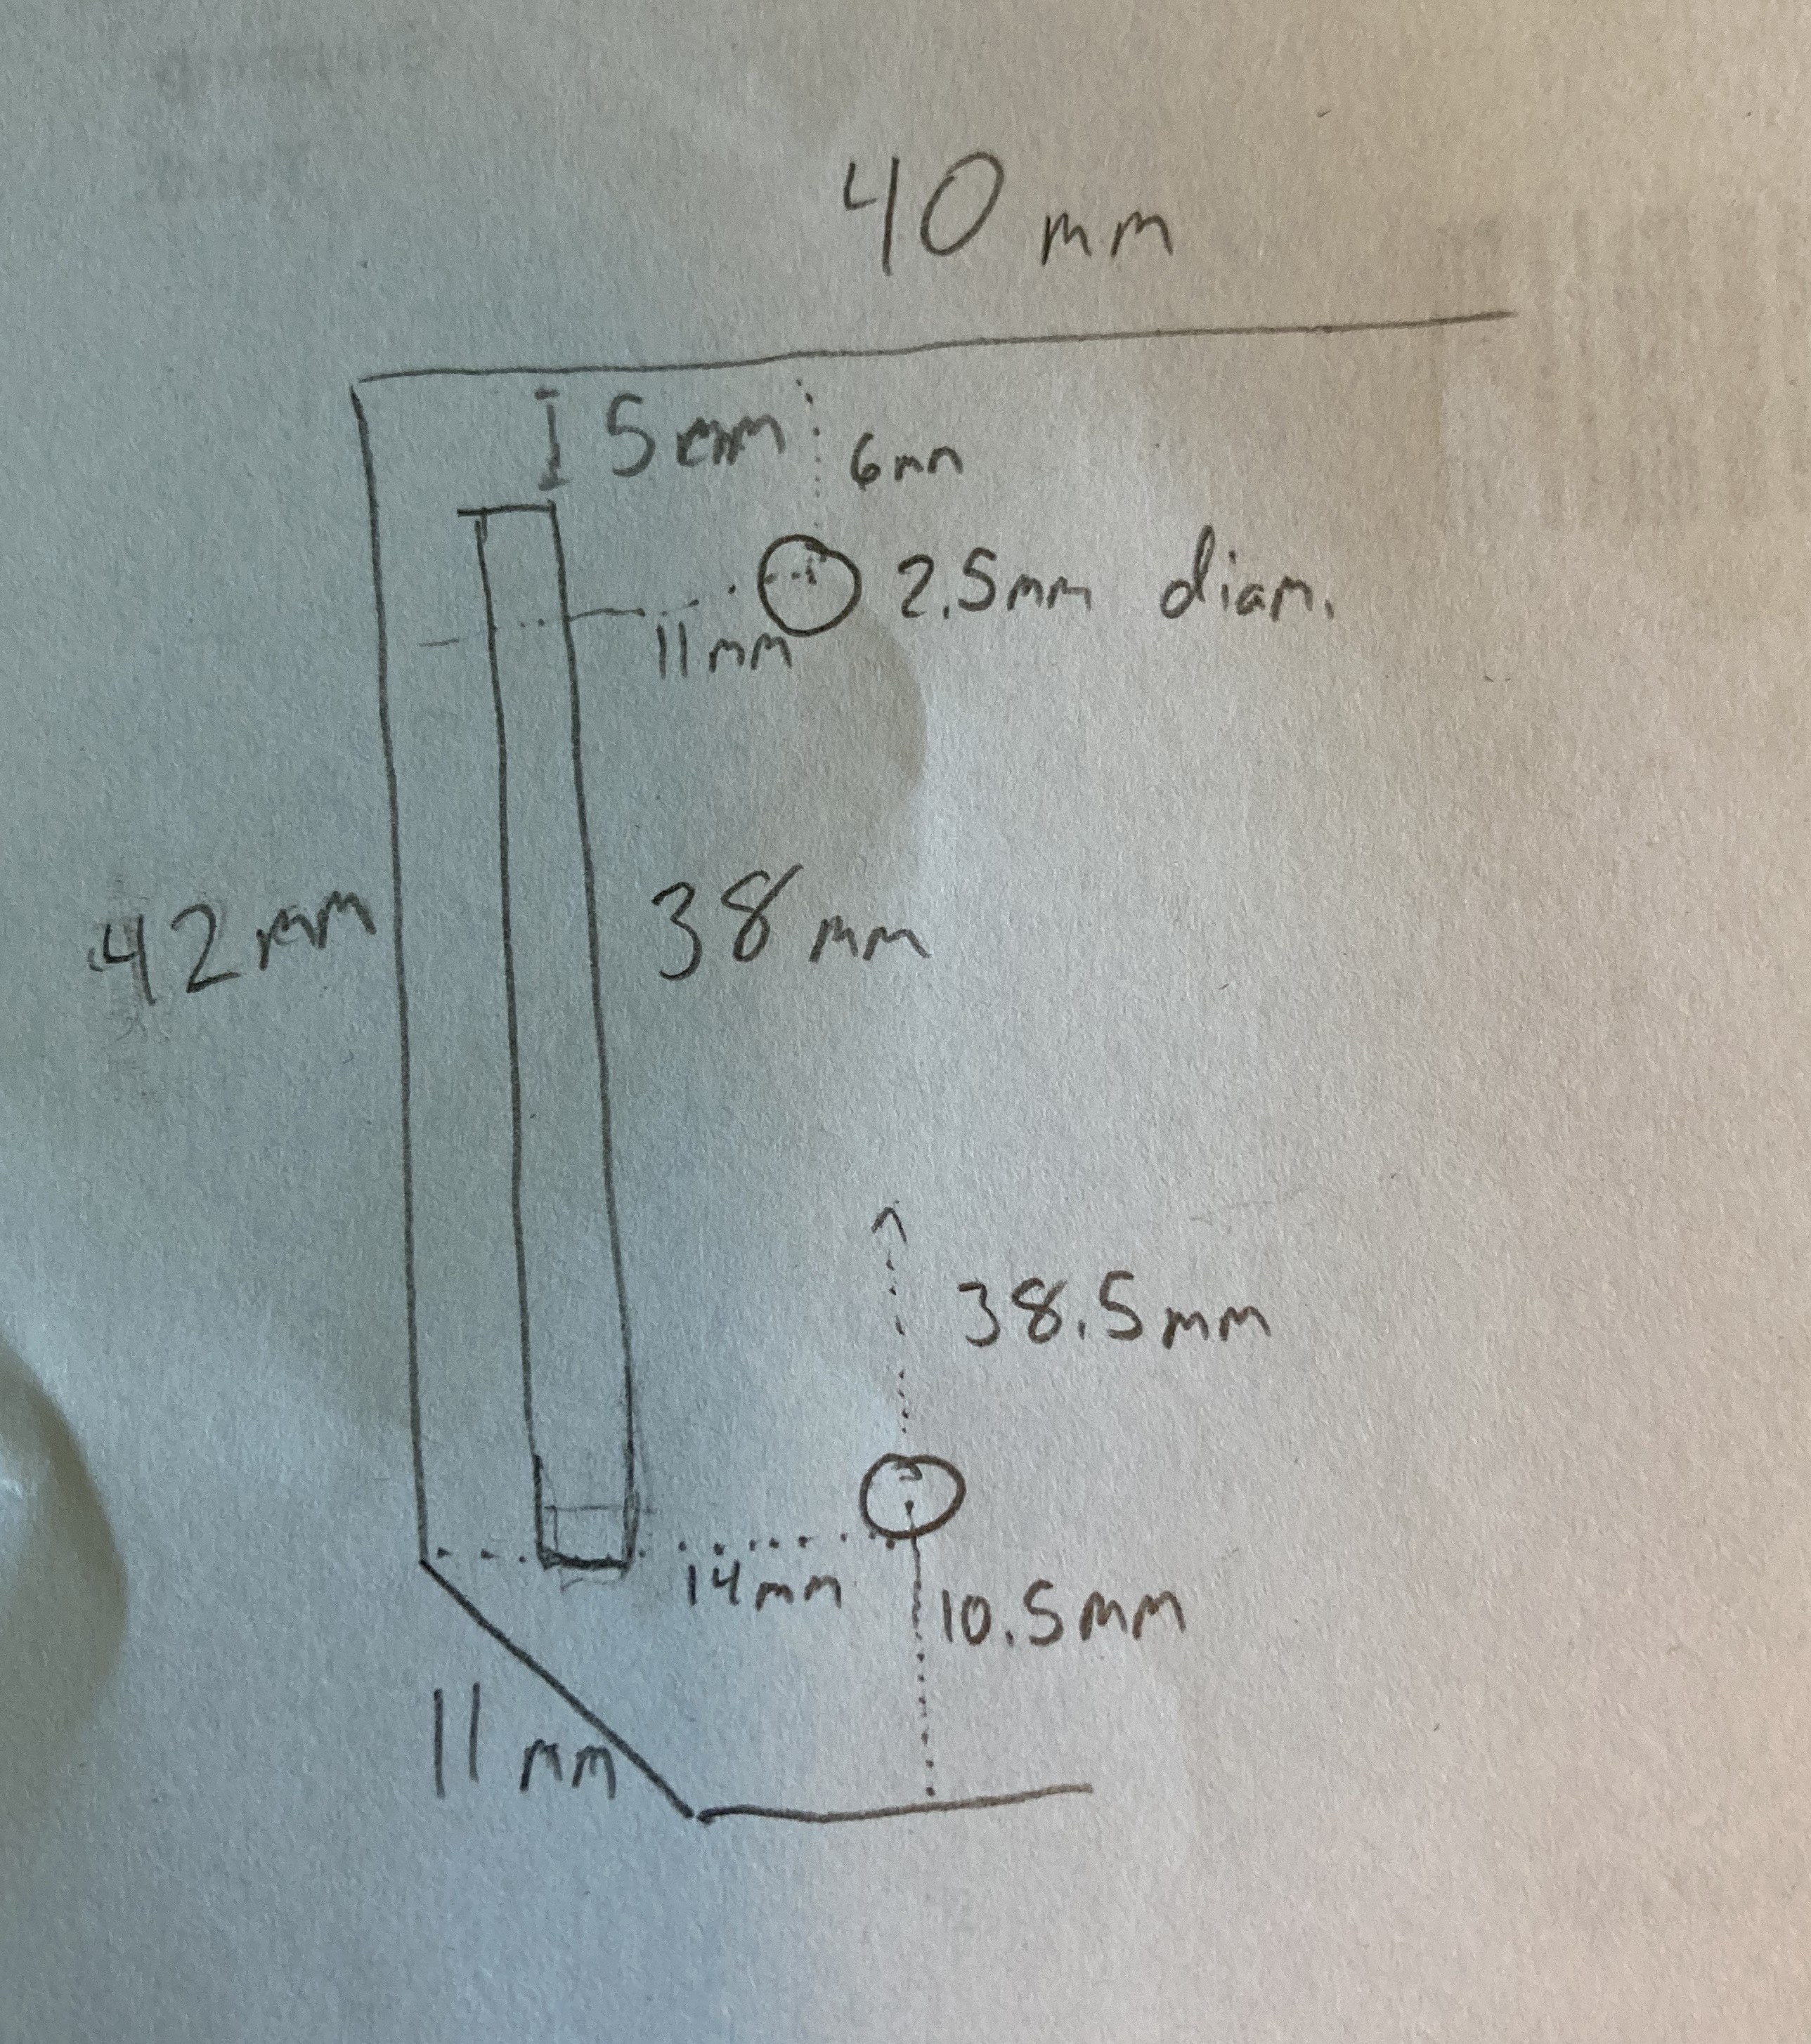
Measuring dimensions and mounting holes Also, you have to pick through-hole sizes and trace widths. Jon had me use .250 mm for the narrow traces and .500 mm for the wider ones, presumably from experience. I used the narrow traces for signalling and wide traces for power, though I’ve since heard it’s a good idea to use narrow traces between filter capacitors and VBUS.

PCB layout in KiCad Of course, there’s some iteration between the schematic and the PCB. After physically placing the ribbon cable connector and MCU, the traces all crossed over each other, so I had to reassign all the pins so it made sense physically.
There are also physical constraints about how USB data lines are run, and how the electrostatic protection chip wants to be placed for the most protection.
So, as simple as this board is, I spent a fair amount of time getting all of that right.
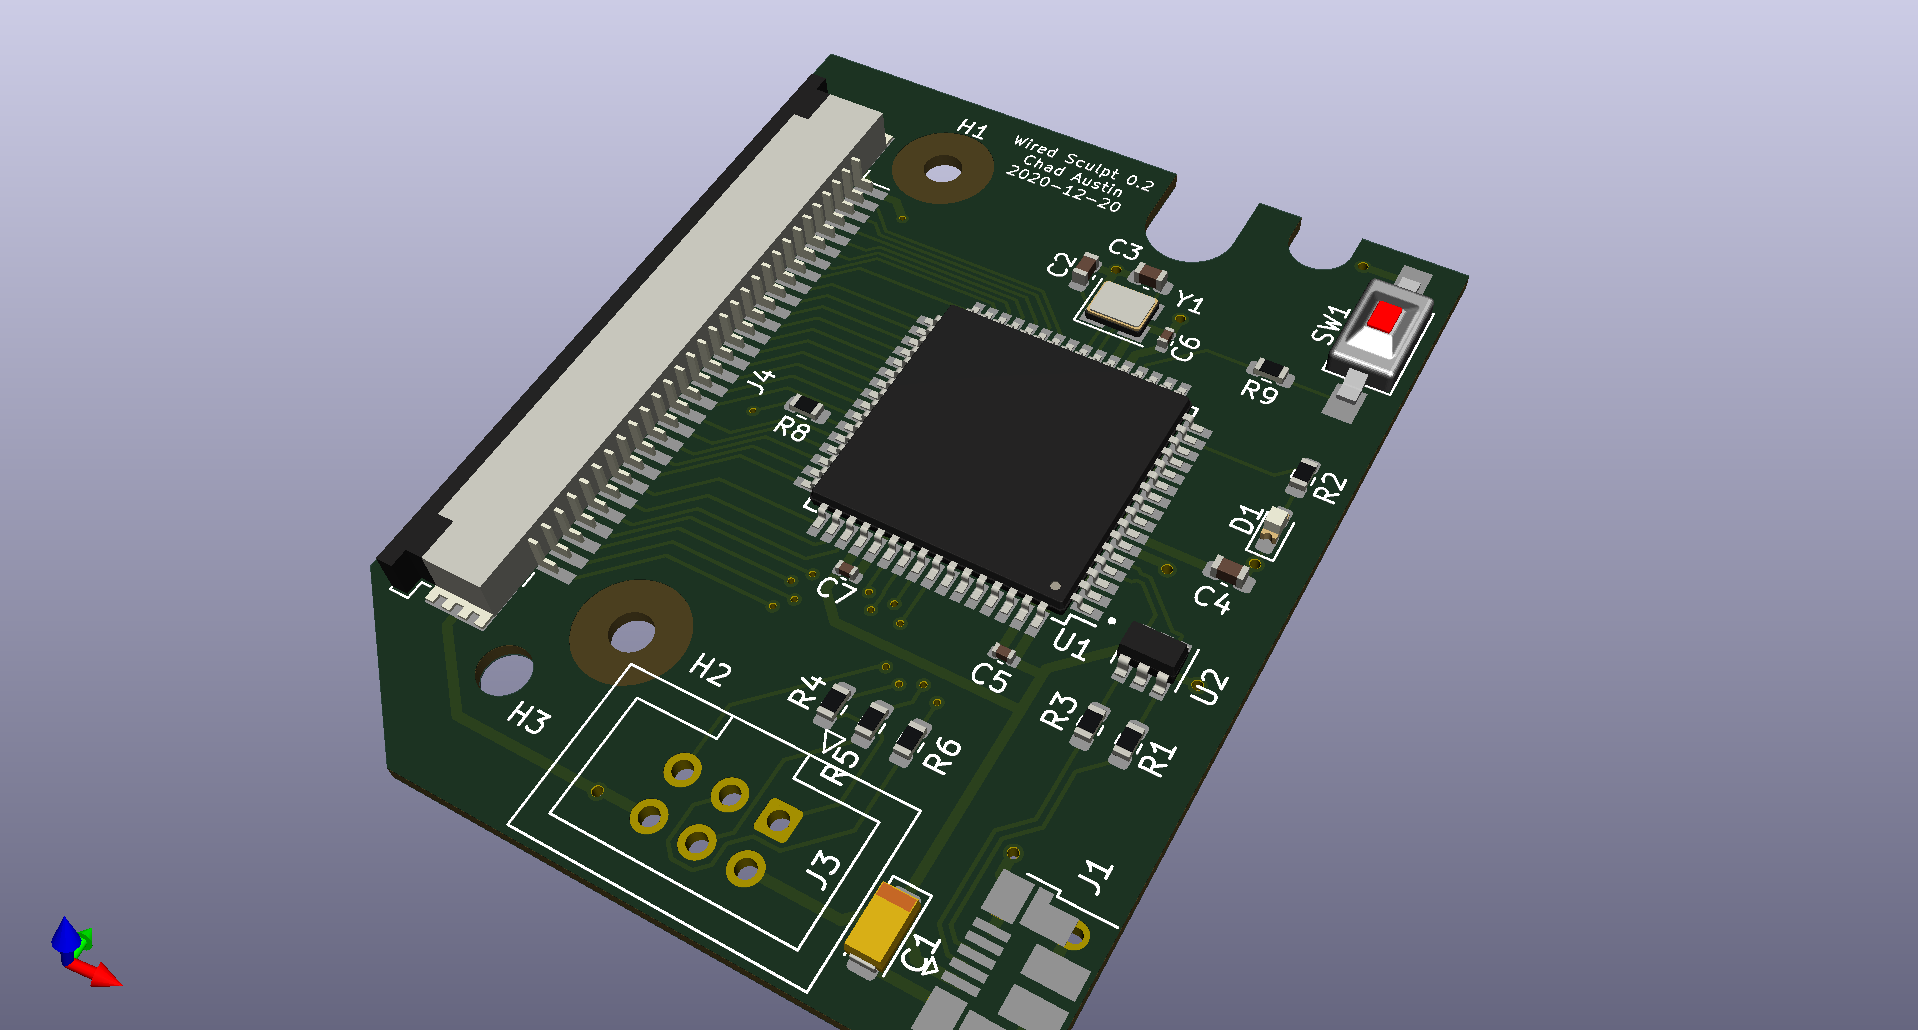
I found myself getting lost in the abstractness of holes and traces and footprints, so it was helpful to ground myself by occasionally loading the PCB in KiCad’s 3D viewer.
3D View Designing the Final Board - Manufacturing and Testing Physical Fit
I tried to find a low-cost prototyping service in the USA, but it looks like China is still the best option if you want a PCB manufactured and assembled for an amount I’m willing to spend on a keyboard.
I saw PCBWay recommended somewhere, and it seemed like a fine choice. Their site has tutorials that walk you through submitting your Gerber files in a way they can process.
Before buying any components or doing assembly, I figured it would be smart to do a test order, just to physically look at the board and make sure it fit.
Good thing, because it didn’t! The mounting holes were about half a millimeter off, and the clearance was tight enough that half a millimeter mattered.
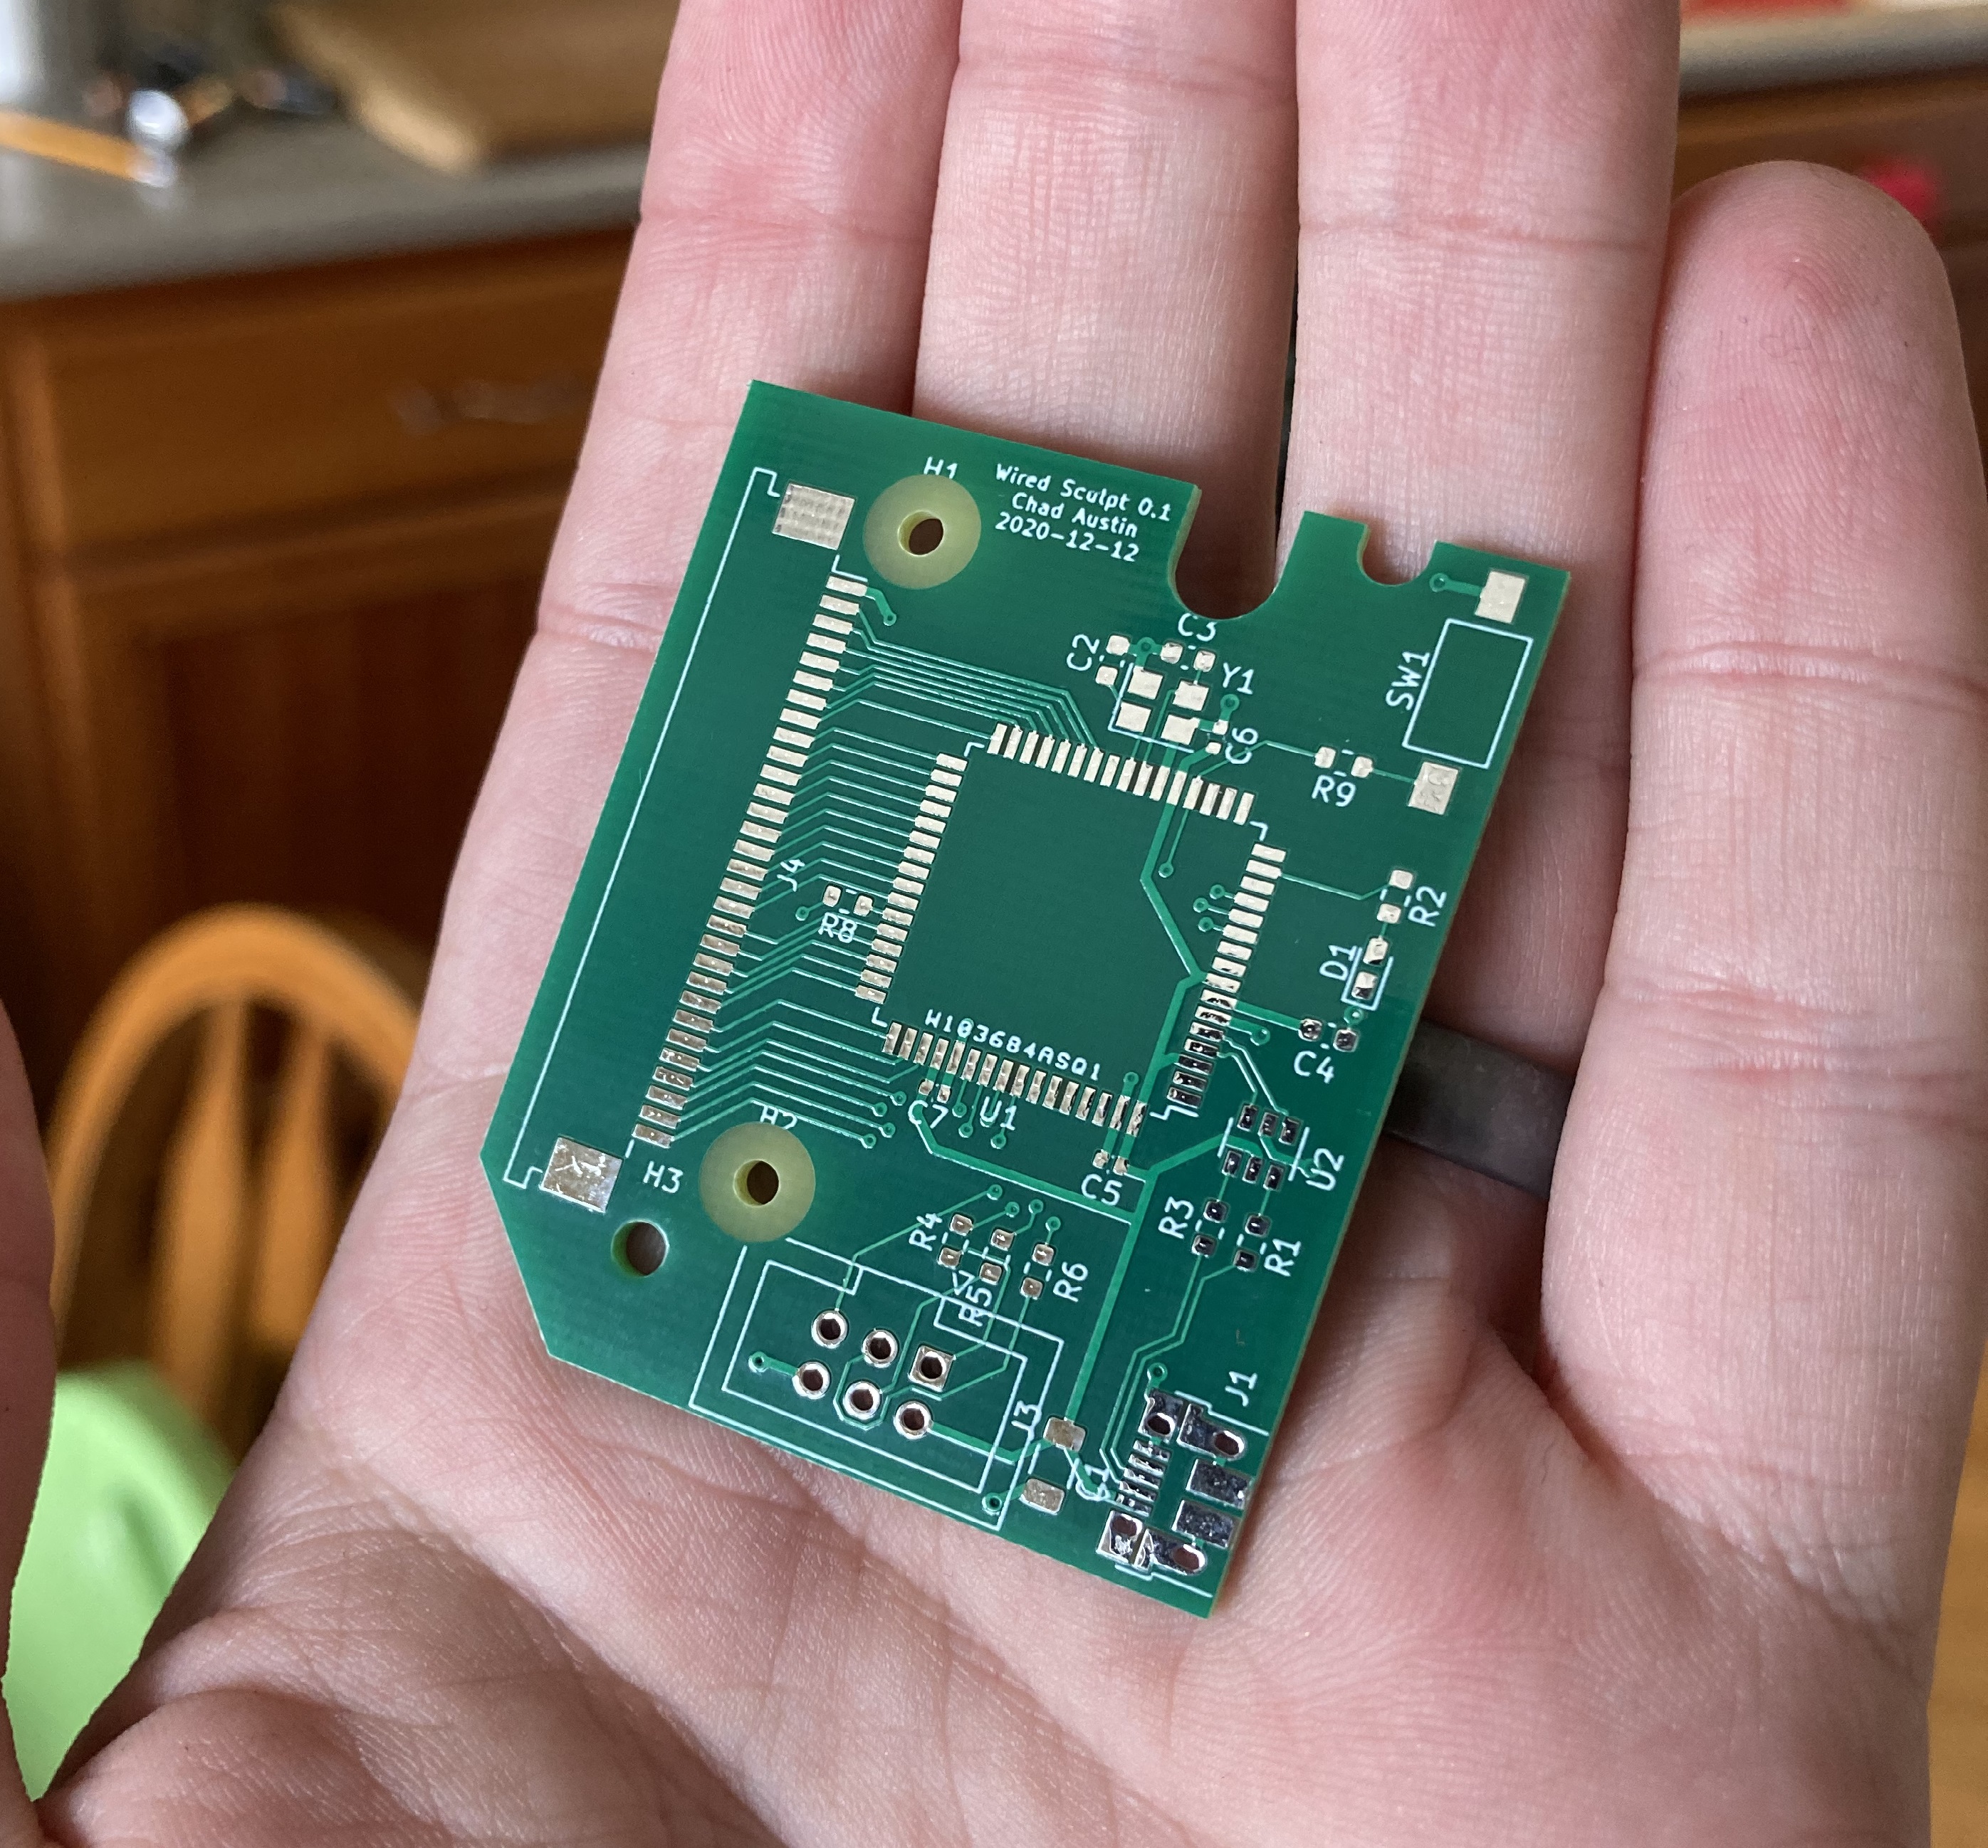
First board! I couldn’t stop playing with it! It’s so magical to have the lines drawn in software turned into physical fiberglass and copper.
Designing the Final Board - Assembly
After making a couple adjustments and updating the version number and date on the silkscreen, I sent another order to PCBWay, this time requesting assembly service.
Overall, I was impressed with their communication. They couldn’t get the specific LED I’d listed in my BOM and confirmed if a substitution was okay.
Then, after all the parts were sourced, they asked me to clarify the polarity of the main tantalum bypass capacitor, since I’d forgotten to indicate anything on the silkscreen.
Finally, before shipping the assembled board, they sent me high-resolution photos of each side and asked me to confirm orientations and assembly.
Top of assembled board 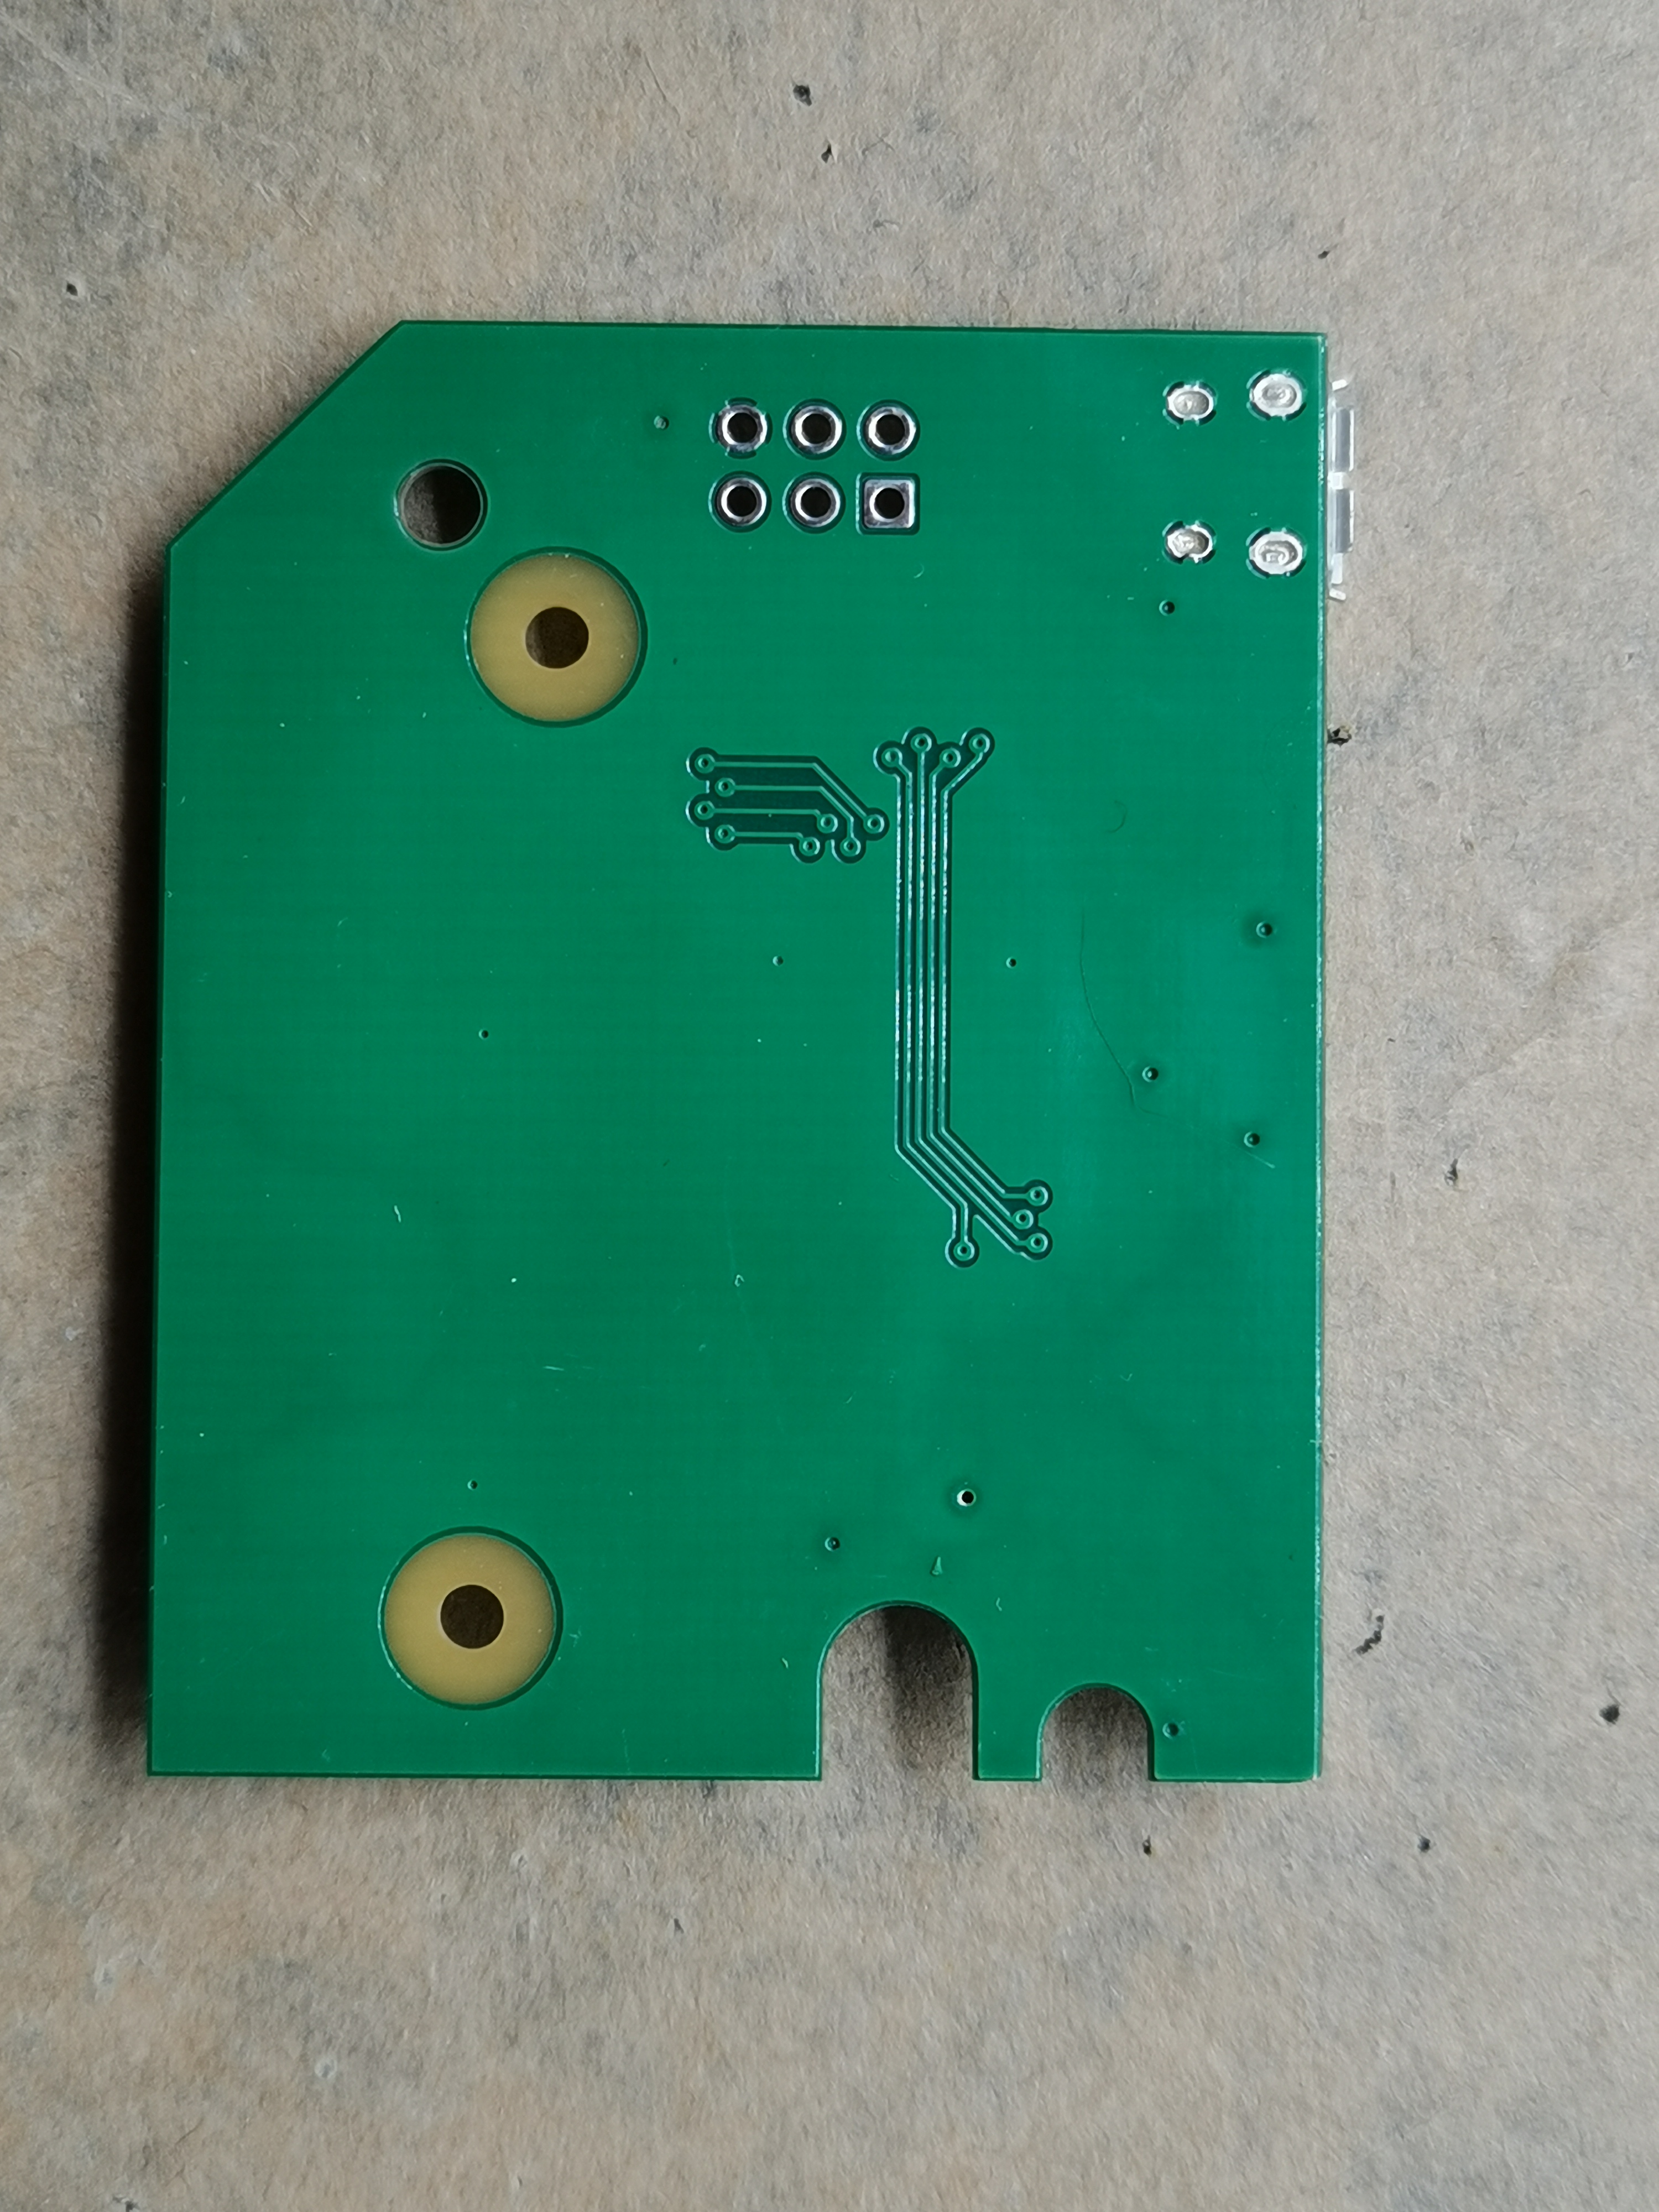
Bottom of assembled board It all looked correct to me, though I later noticed that one of the traces is lifted. (There is still connectivity, and it’s not a huge deal, as that trace is only connected to an LED that I haven’t gotten to work anyway.)
It took about a month for the assembled board to arrive. I checked the assembly status every day. Maybe next time I’ll expedite. :)
Overall, I was pretty happy:
- My first test order, the minimum, was cheap and came with a cute battery-powered LED Christmas tree ornament.
- They made my board even though it was technically smaller than their minimum size.
- They took care of setting up the alignment holes for the pick-and-place machine, and sent me individual boards. I didn’t have to do any panelization.
- Shipping from China seemed unreasonably fast, but I suppose that’s how things work these days.
Electrical Testing

The second revision fit in the case! Before powering anything, I carefully did an electrical connectivity test of the main power circuits. Wanted to make sure the first power-on wasn’t going to result in a puff of blue smoke.
I briefly panicked, thinking everything was installed backwards, until I discovered my crappy little multimeter, in continuity mode, runs current from COM to positive. So I kept thinking there was a short somewhere on the board, and I’d have to disassemble to debug it! In reality, it was showing the ESD protection circuitry correctly shunting current from GND to VBUS.
When I realized this and reversed the leads, everything was correct. (And I bought a nicer multimeter which doesn’t have this problem.)
There was an electrical issue, however! Most of the pins on the ribbon cable connector weren’t soldered down to the board. I don’t know if this is a solder mask issue with the footprint in KiCad or if the board wasn’t flat enough for the paste on each pad to connect upwards to the leg.
I was afraid of forming bridges between the 1 mm pitch fins, so I coated the entire area in flux and very carefully swiped solder upwards from the pad. It took three passes before I was able to measure reliable connectivity between each ribbon pin and the corresponding microcontroller leg.
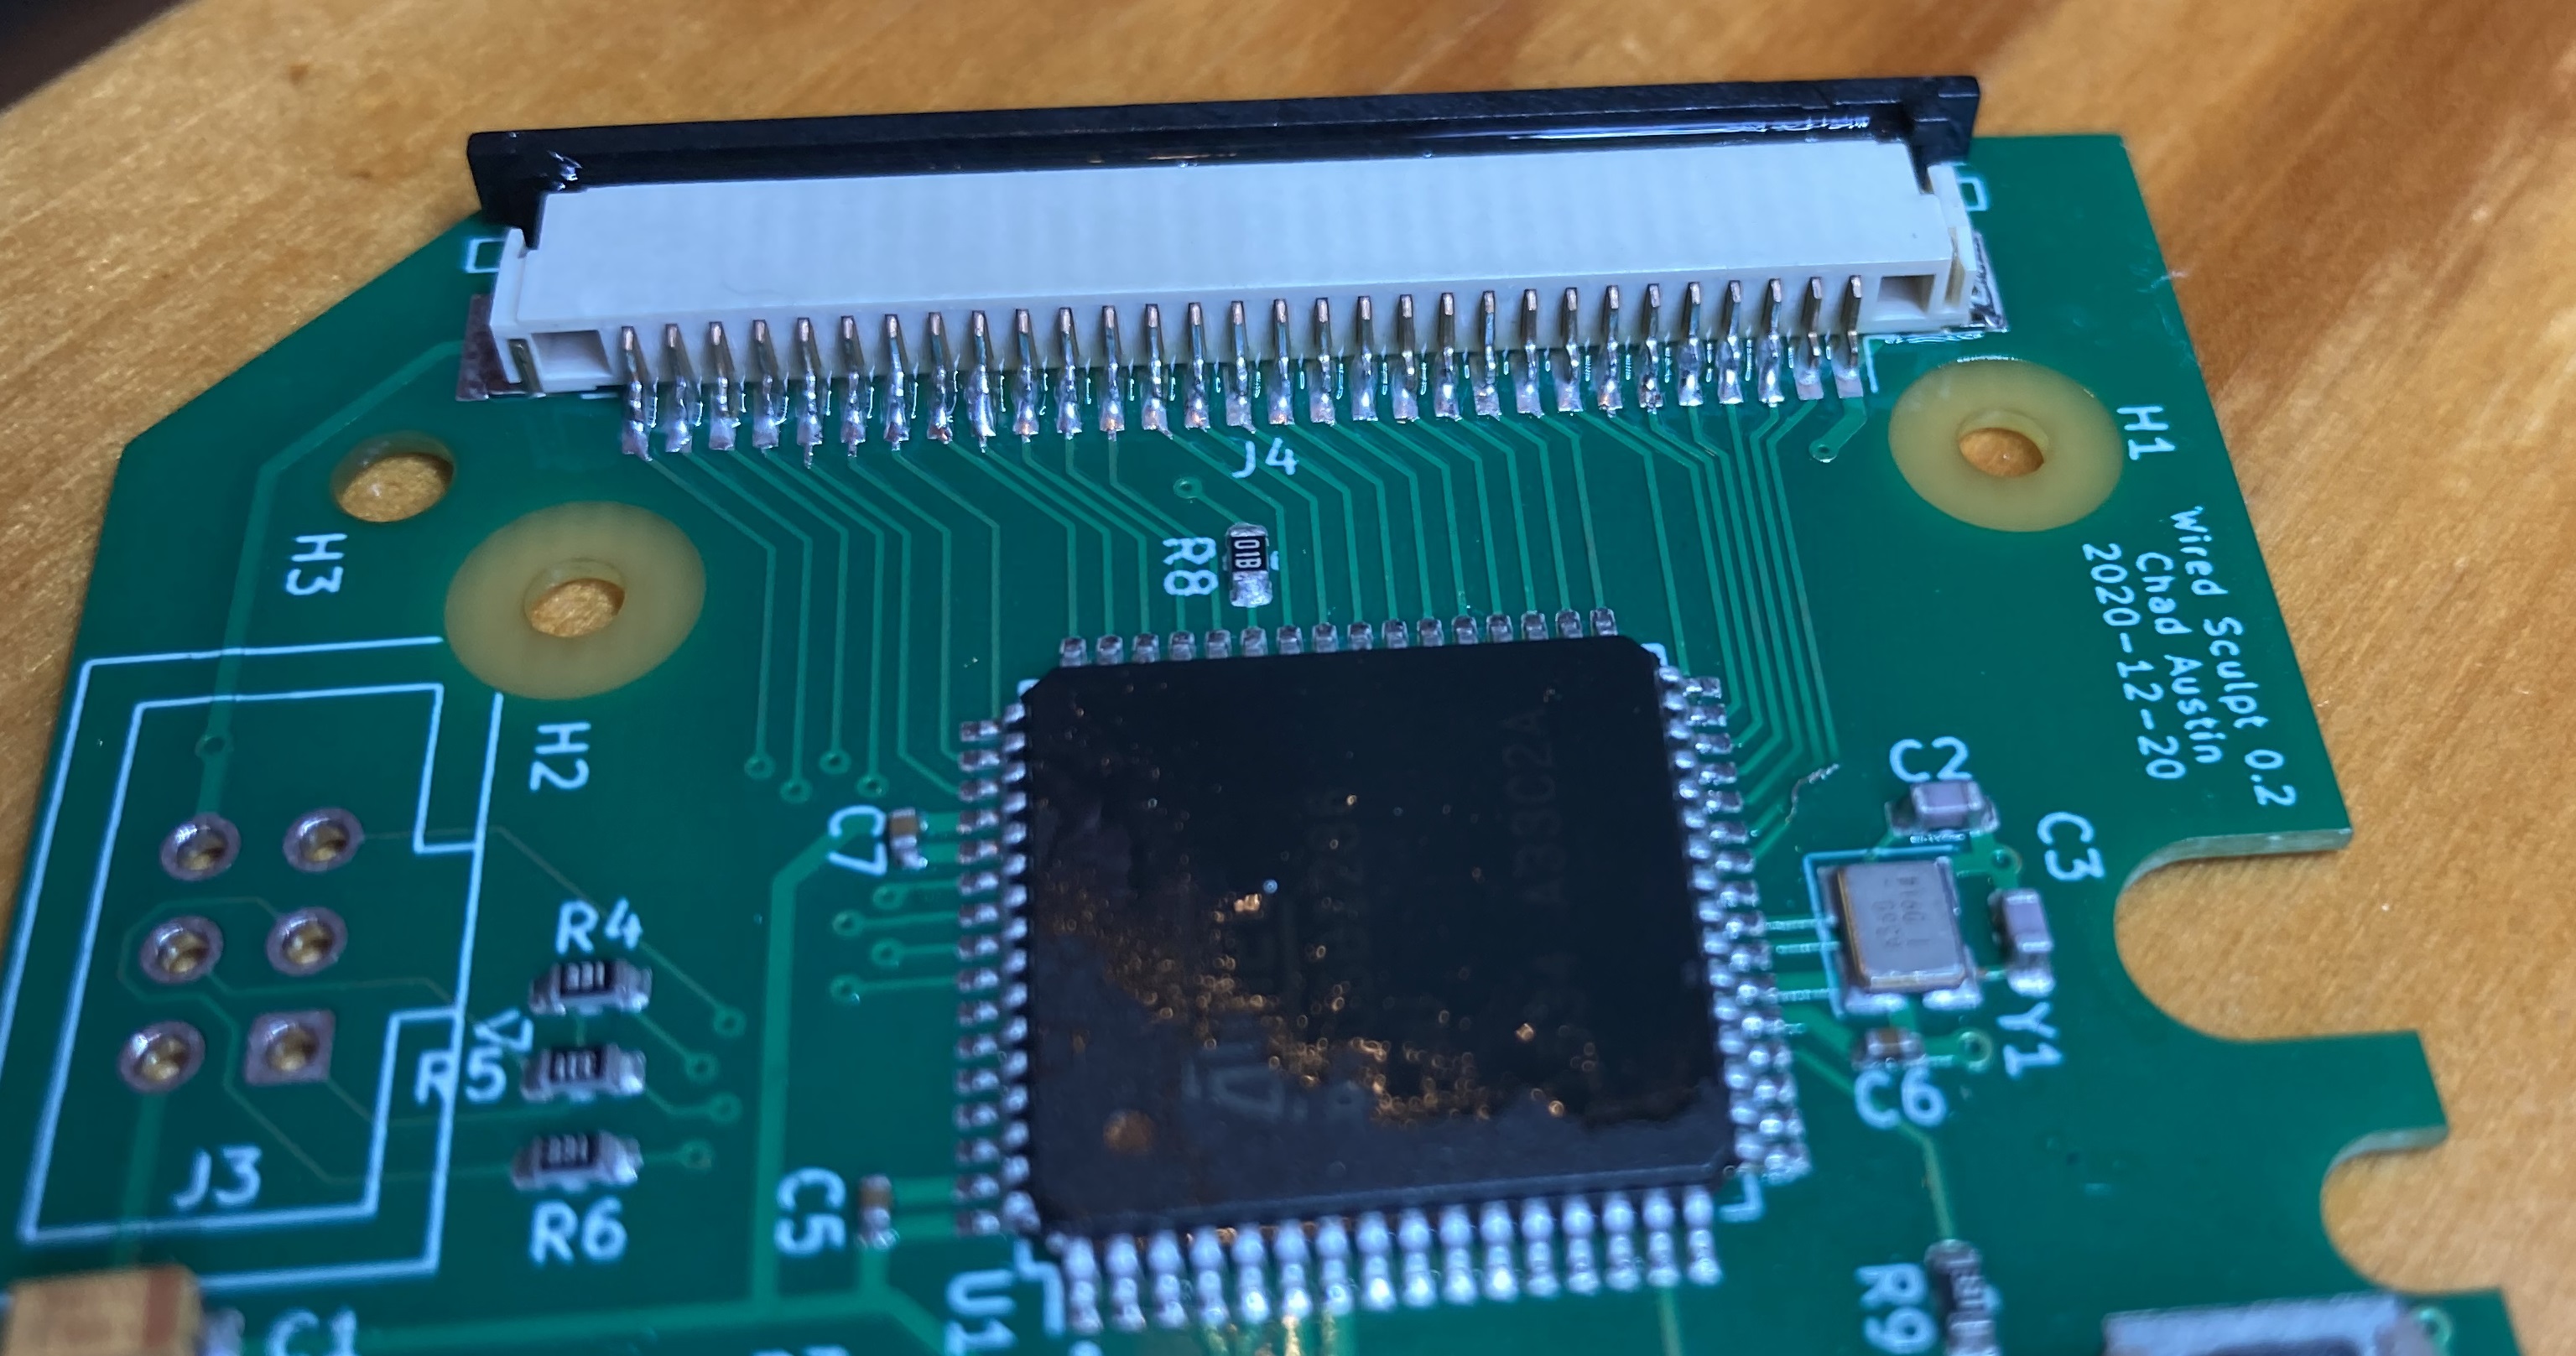
Resoldered FPC connector legs I see why people use microscopes for this stuff.
Fuses and Firmware
Now that everything seemed electrically correct, it was time to plug it in. Success! The factory-supplied DFU bootloader device showed up.
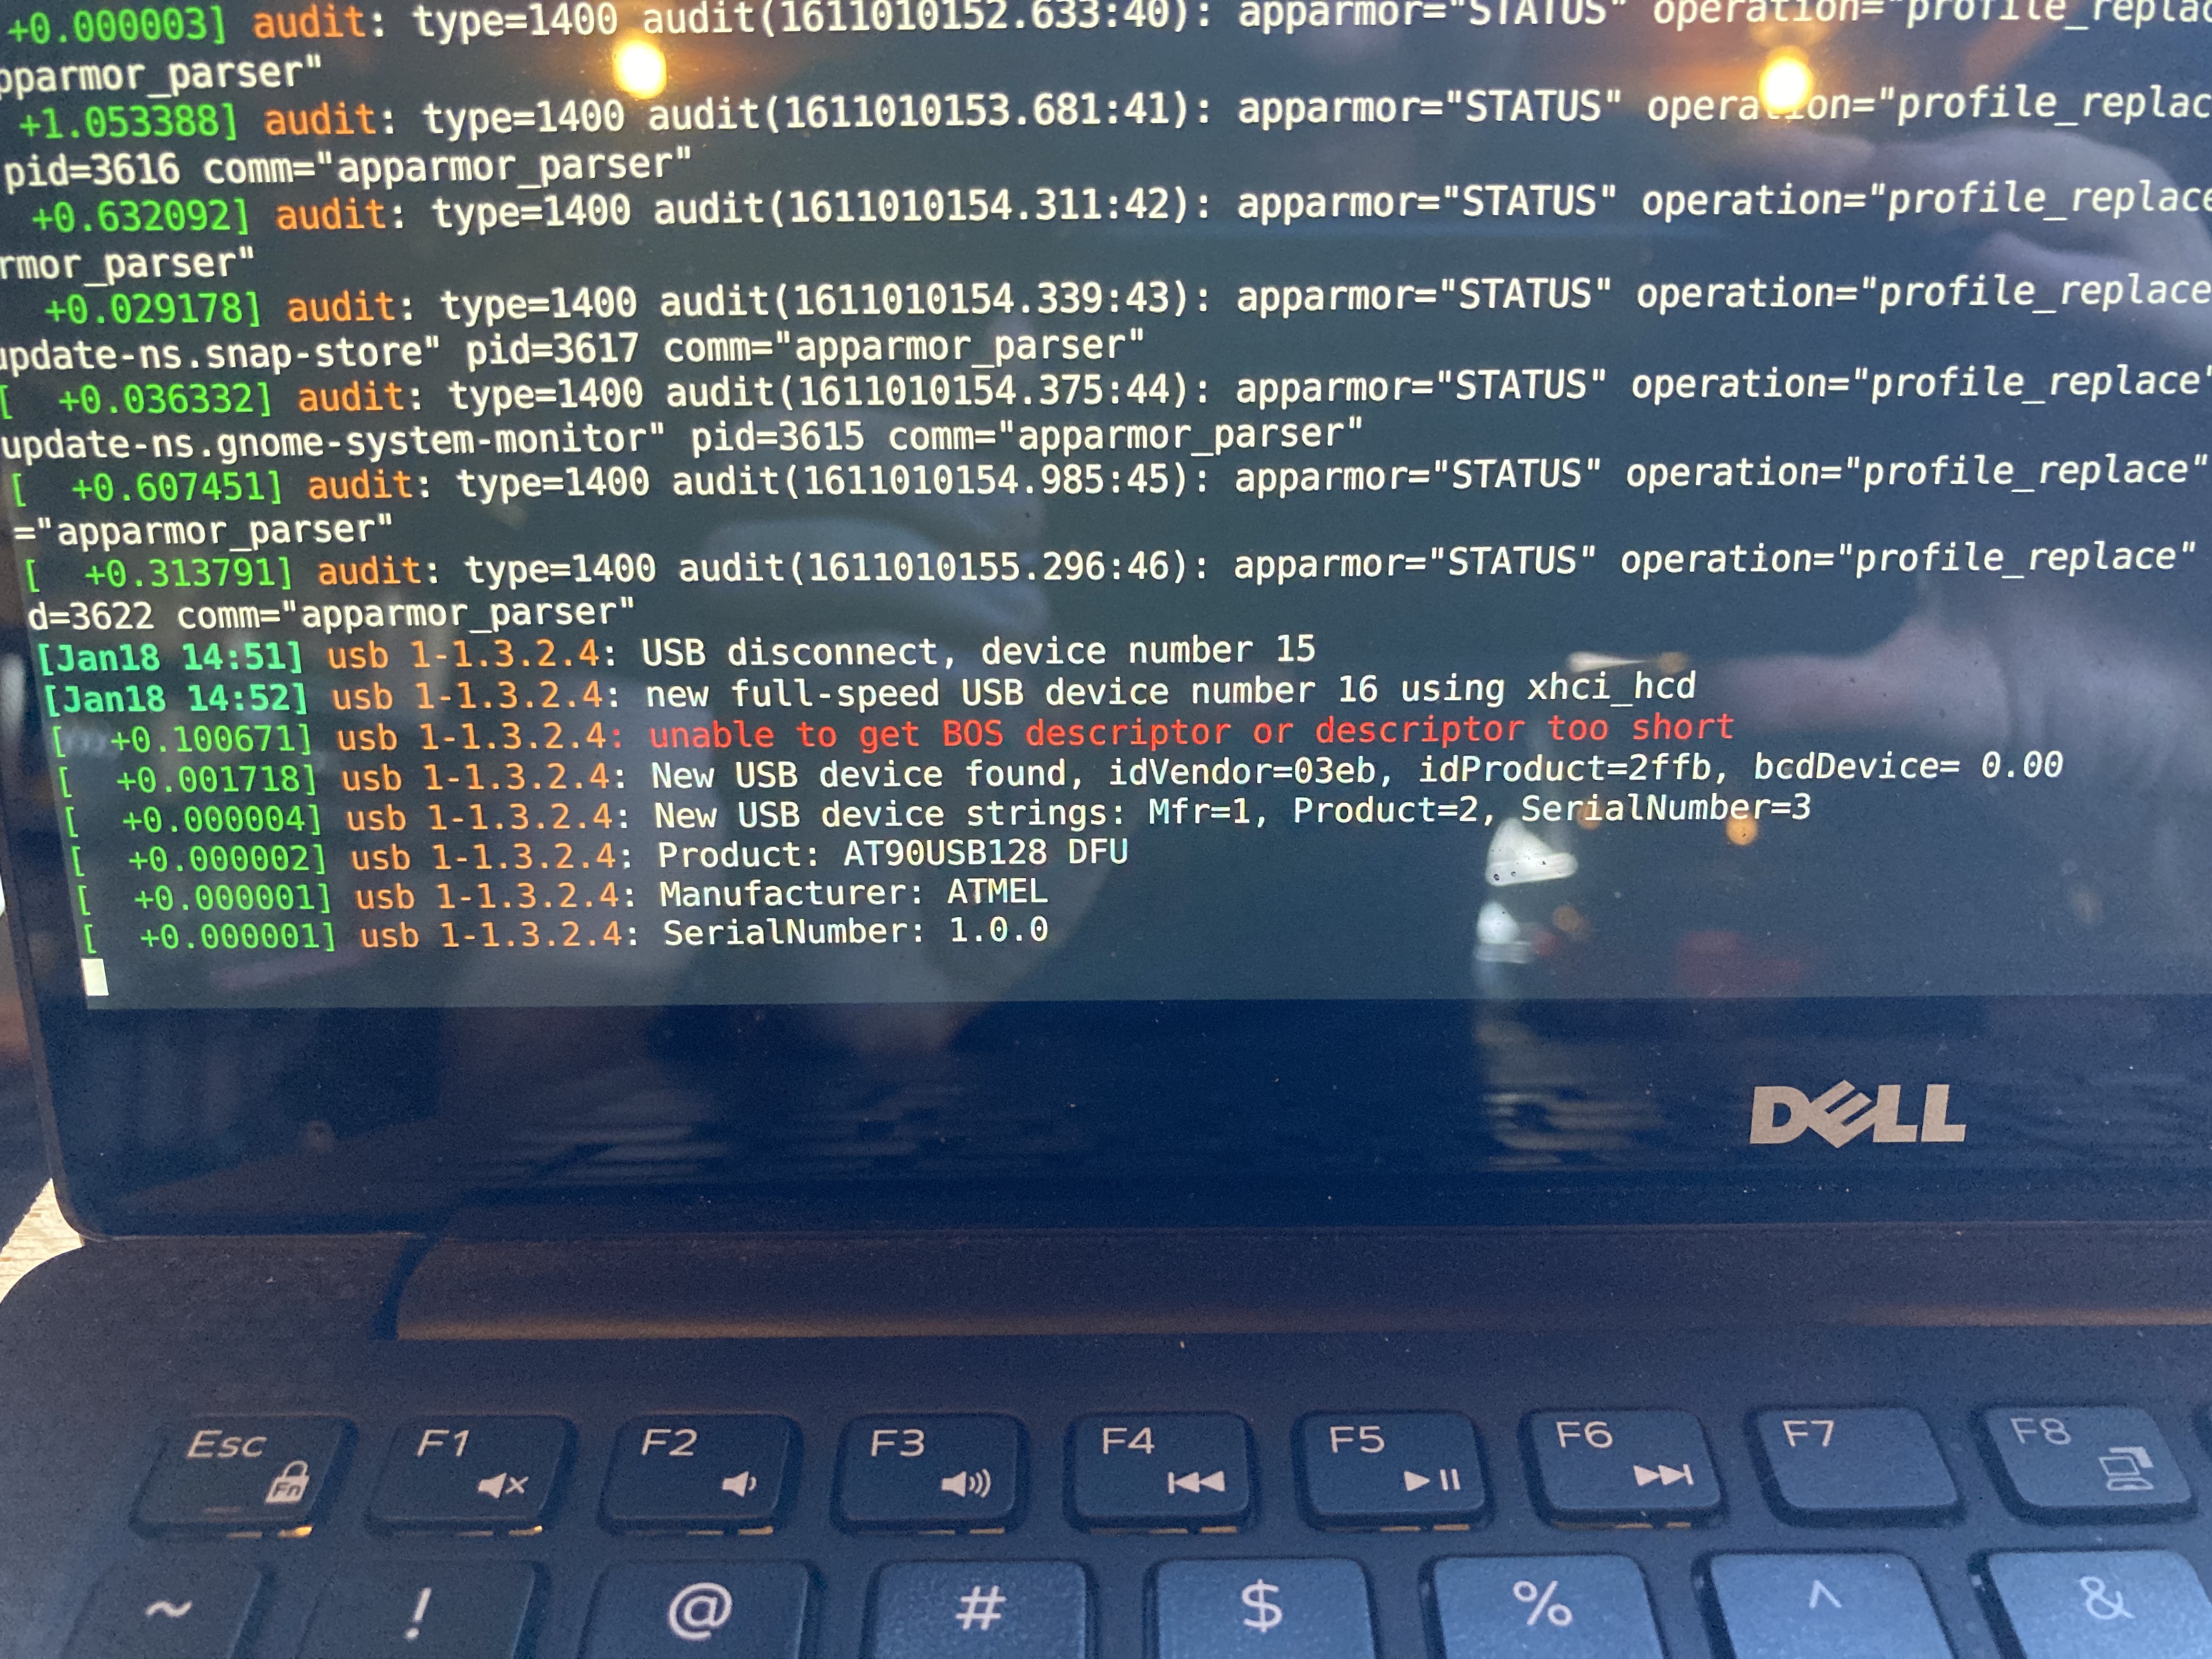
Linux recognized the DFU bootloader device! With
dfu-programmer, I uploaded a tiny C program that simply blinked the test LED pin at 1 Hz. First weirdness: the clock speed seemed to be incorrect. After some careful datasheet reading, long story short, the CLKDIV fuse bit comes preprogrammed, which divides your clock speed by 8. So the crystal was 16 MHz, but the MCU was dividing that down to 2 MHz. I had expected it to use the internal RC oscillator by default, which would have resulted in a 1 MHz clock.You can change the fuse bits with an in-circuit programmer device (not USB!), but that has the side effect of erasing the convenient factory-supplied USB bootloader, which I’d prefer to leave alone if possible. (There’s a LUFA bootloader you can upload, but since all of this was new, baby steps felt good.)
Fortunately, for this device, none of the above actually matters! It turns out I can get away without programming any fuse bits. CLKDIV merely sets the default clock speed divisor, and you can change it in software at the start of your program:
clock_prescale_set(clock_div_1);The result of all of this is that the six AVR ISP pins on the board are only necessary in emergencies. (Good thing, because I borrowed two of the pins later.) From the factory, it can be flashed with firmware and function as designed.
QMK
After getting the clock speed issues sorted, I flashed QMK — thanks again to Michael Fincham for mapping the layout — and it worked!
The Sculpt treats left and right spacebar as independent keys. Michael took advantage of that and mapped right spacebar to enter. Turns out I couldn’t live with that, so I mapped it back to space.
Now that it’s not necessary for the battery indicator, I repurposed the keyboard’s red LED for Caps Lock.
I’d like to use the green LED too, but I discovered it has reversed polarity, and there’s no easy way to drive it with the current circuit.
Finally, the Sculpt has a Caps Lock indicator Case Fitting and Reassembly
Dremel.
Cut cut! The only complication here was realizing it would be super convenient to launch the bootloader without disassembling the keyboard, so I soldered RST and GND from the AVR ISP pins to a button and hot-glued that into the battery compartment. (HWB is pulled low on the board, so all external resets enter the bootloader.)
To allow future disassembly, I cut up a PC fan extension cable and repurposed the connectors.
Borrowing RST and GND pins 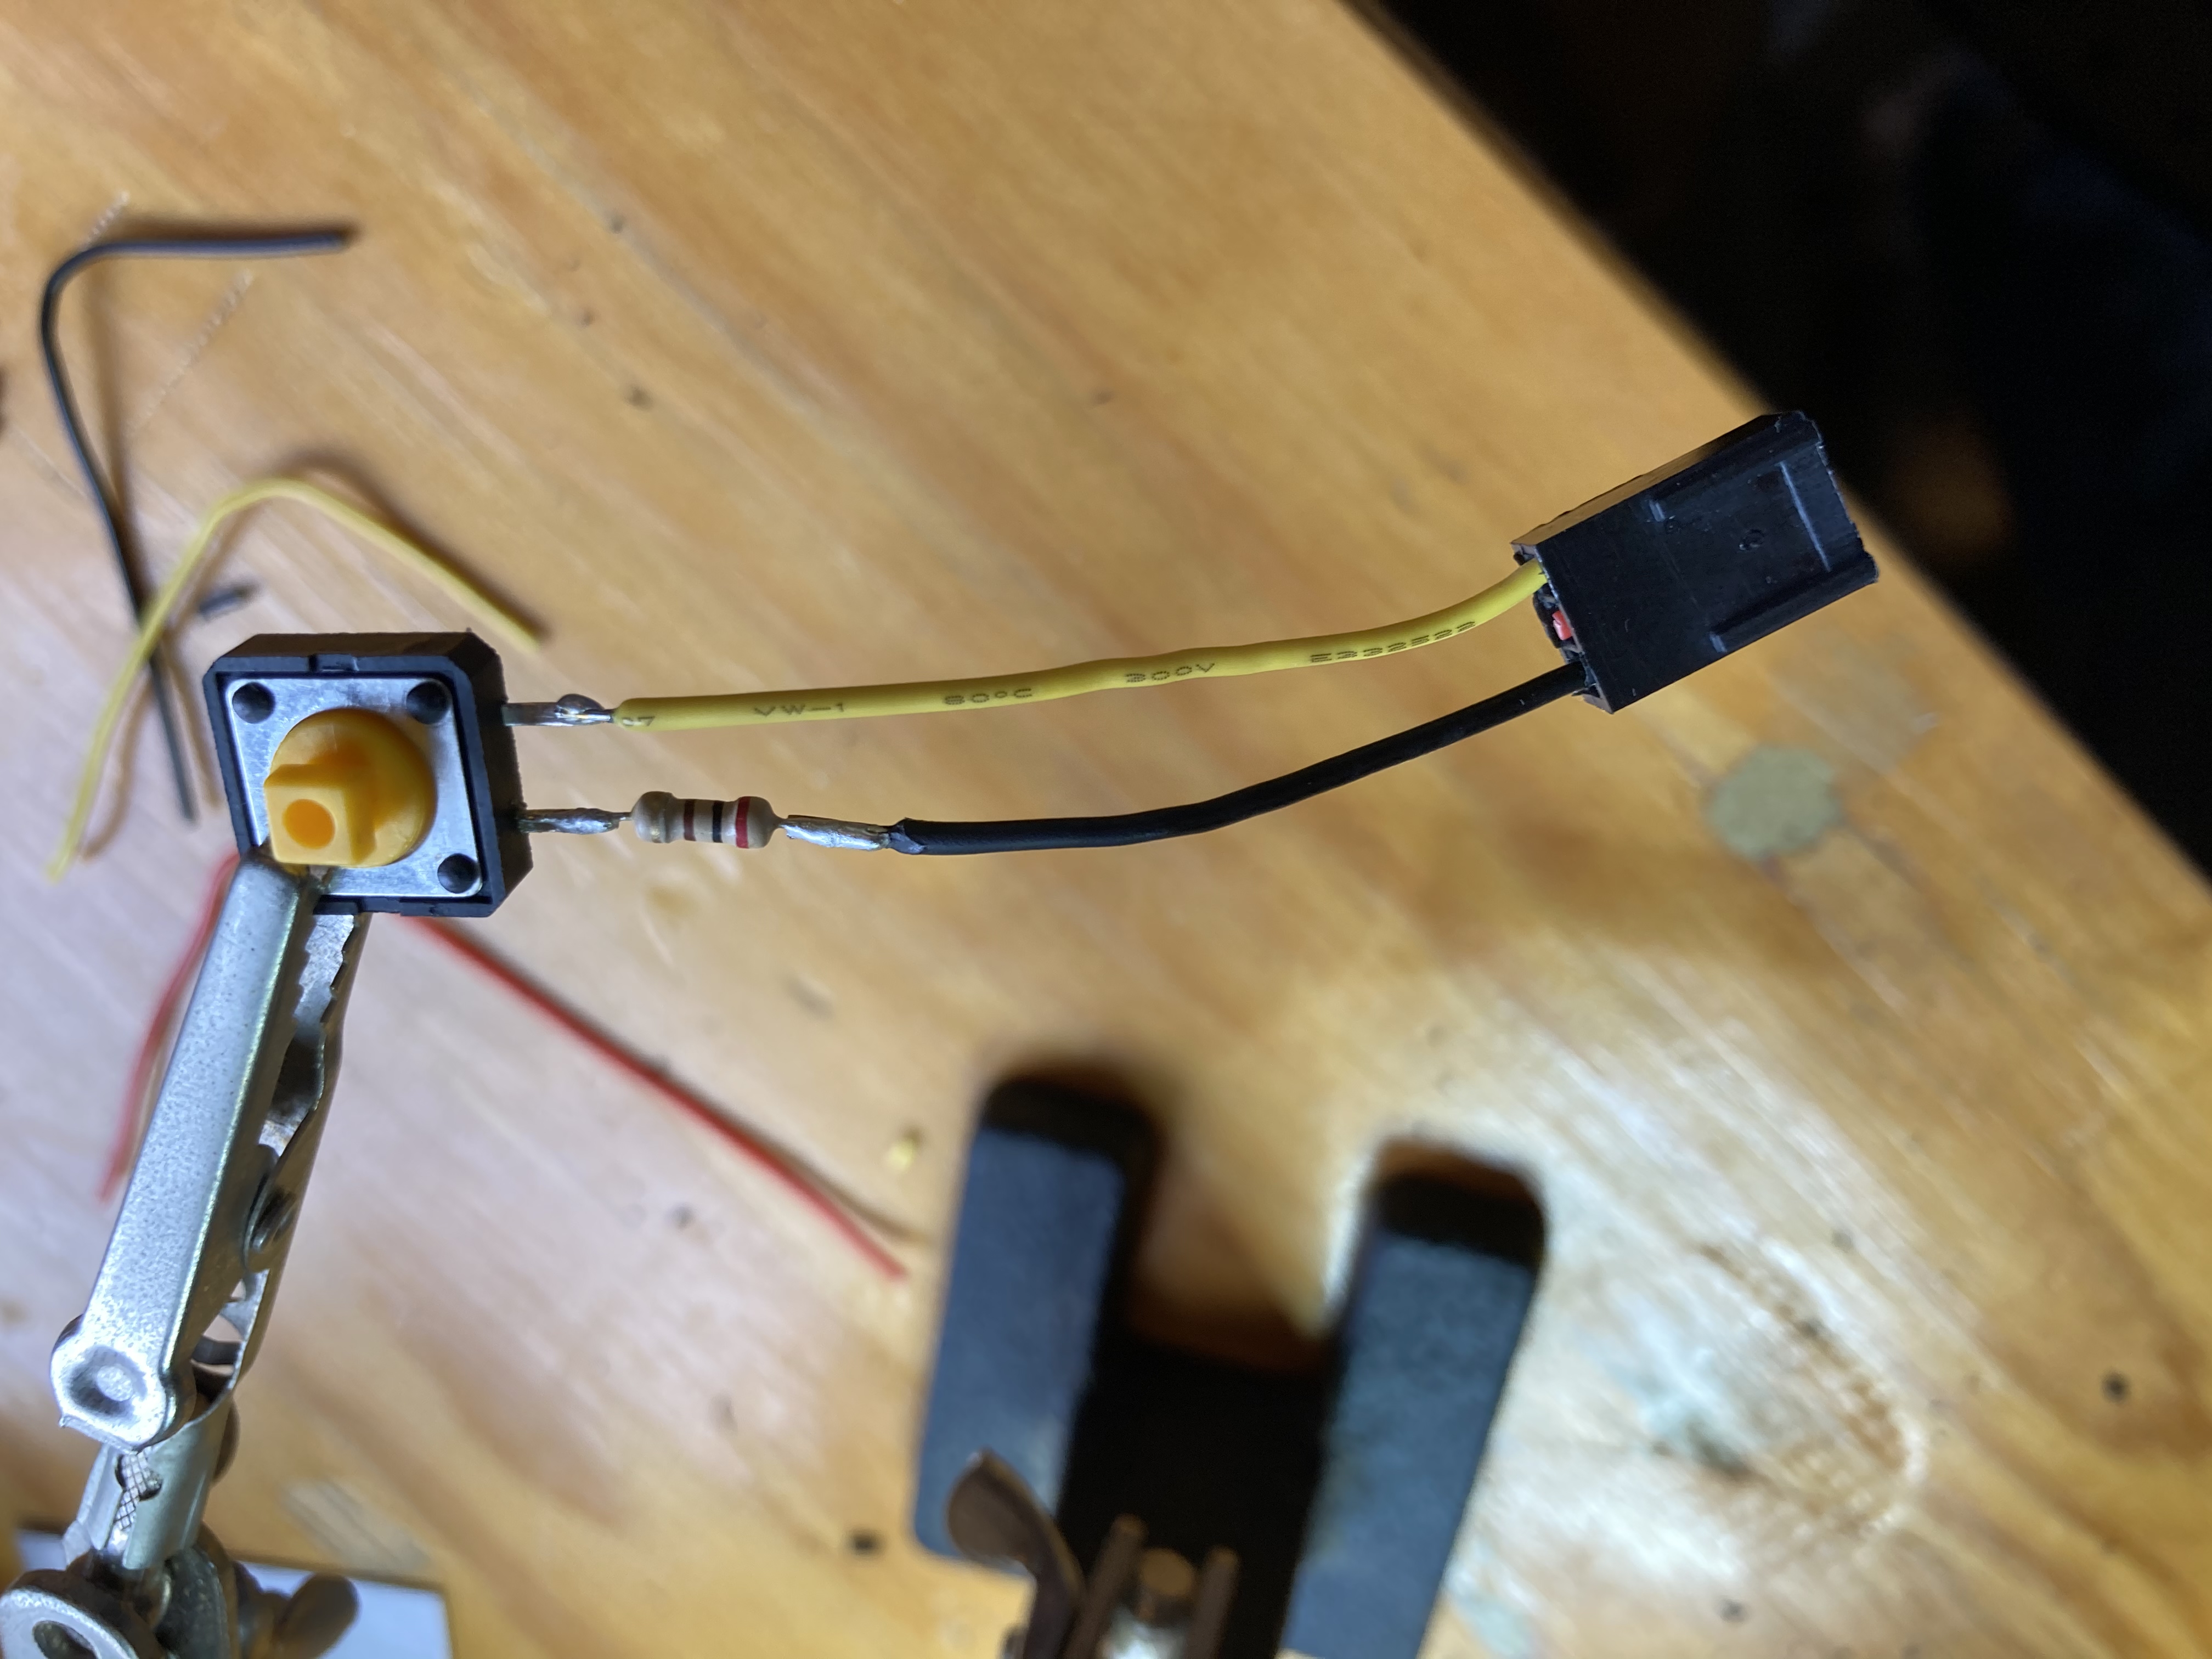
External reset button. I almost forgot the spike-limiting resistor!
All packed up! Latency
I don’t have enough words to convey how happy this modded keyboard makes me.
After years of thinking I was just getting old and losing my dexterity, my computer feels solid again. It’s like a bunch of resistance disappeared. Gaming is easier. Typing is easier. Latency is definitely better, and perhaps more importantly, more consistent.
I fired up Is It Snappy? and measured, on my PC, a total keyboard-to-screen latency reduction from 78 ms to 65. 13 milliseconds better!
I’ll have to test it on my new work laptop, an MSI GS65 Stealth, which measures keypress-to-pixels latency under 30 ms (!).
This project was worth every hour it took.
And during my latency testing, the wireless keyboard repeatedly dropped keys, as if to validate all of my complaints in a final hurrah.
Power
While waiting for the assembled PCB to arrive from China, I modded my Wii sensor bar to take 100 mA from the TV USB and bump it up to the 7.5V required to light its infrared LEDs. I was worried about excessive current draw and potentially damaging the TV’s USB ports, so I picked up a USB meter.
This keyboard draws about 60 mA — a quarter watt — which isn’t bad, but it feels possible to do better.
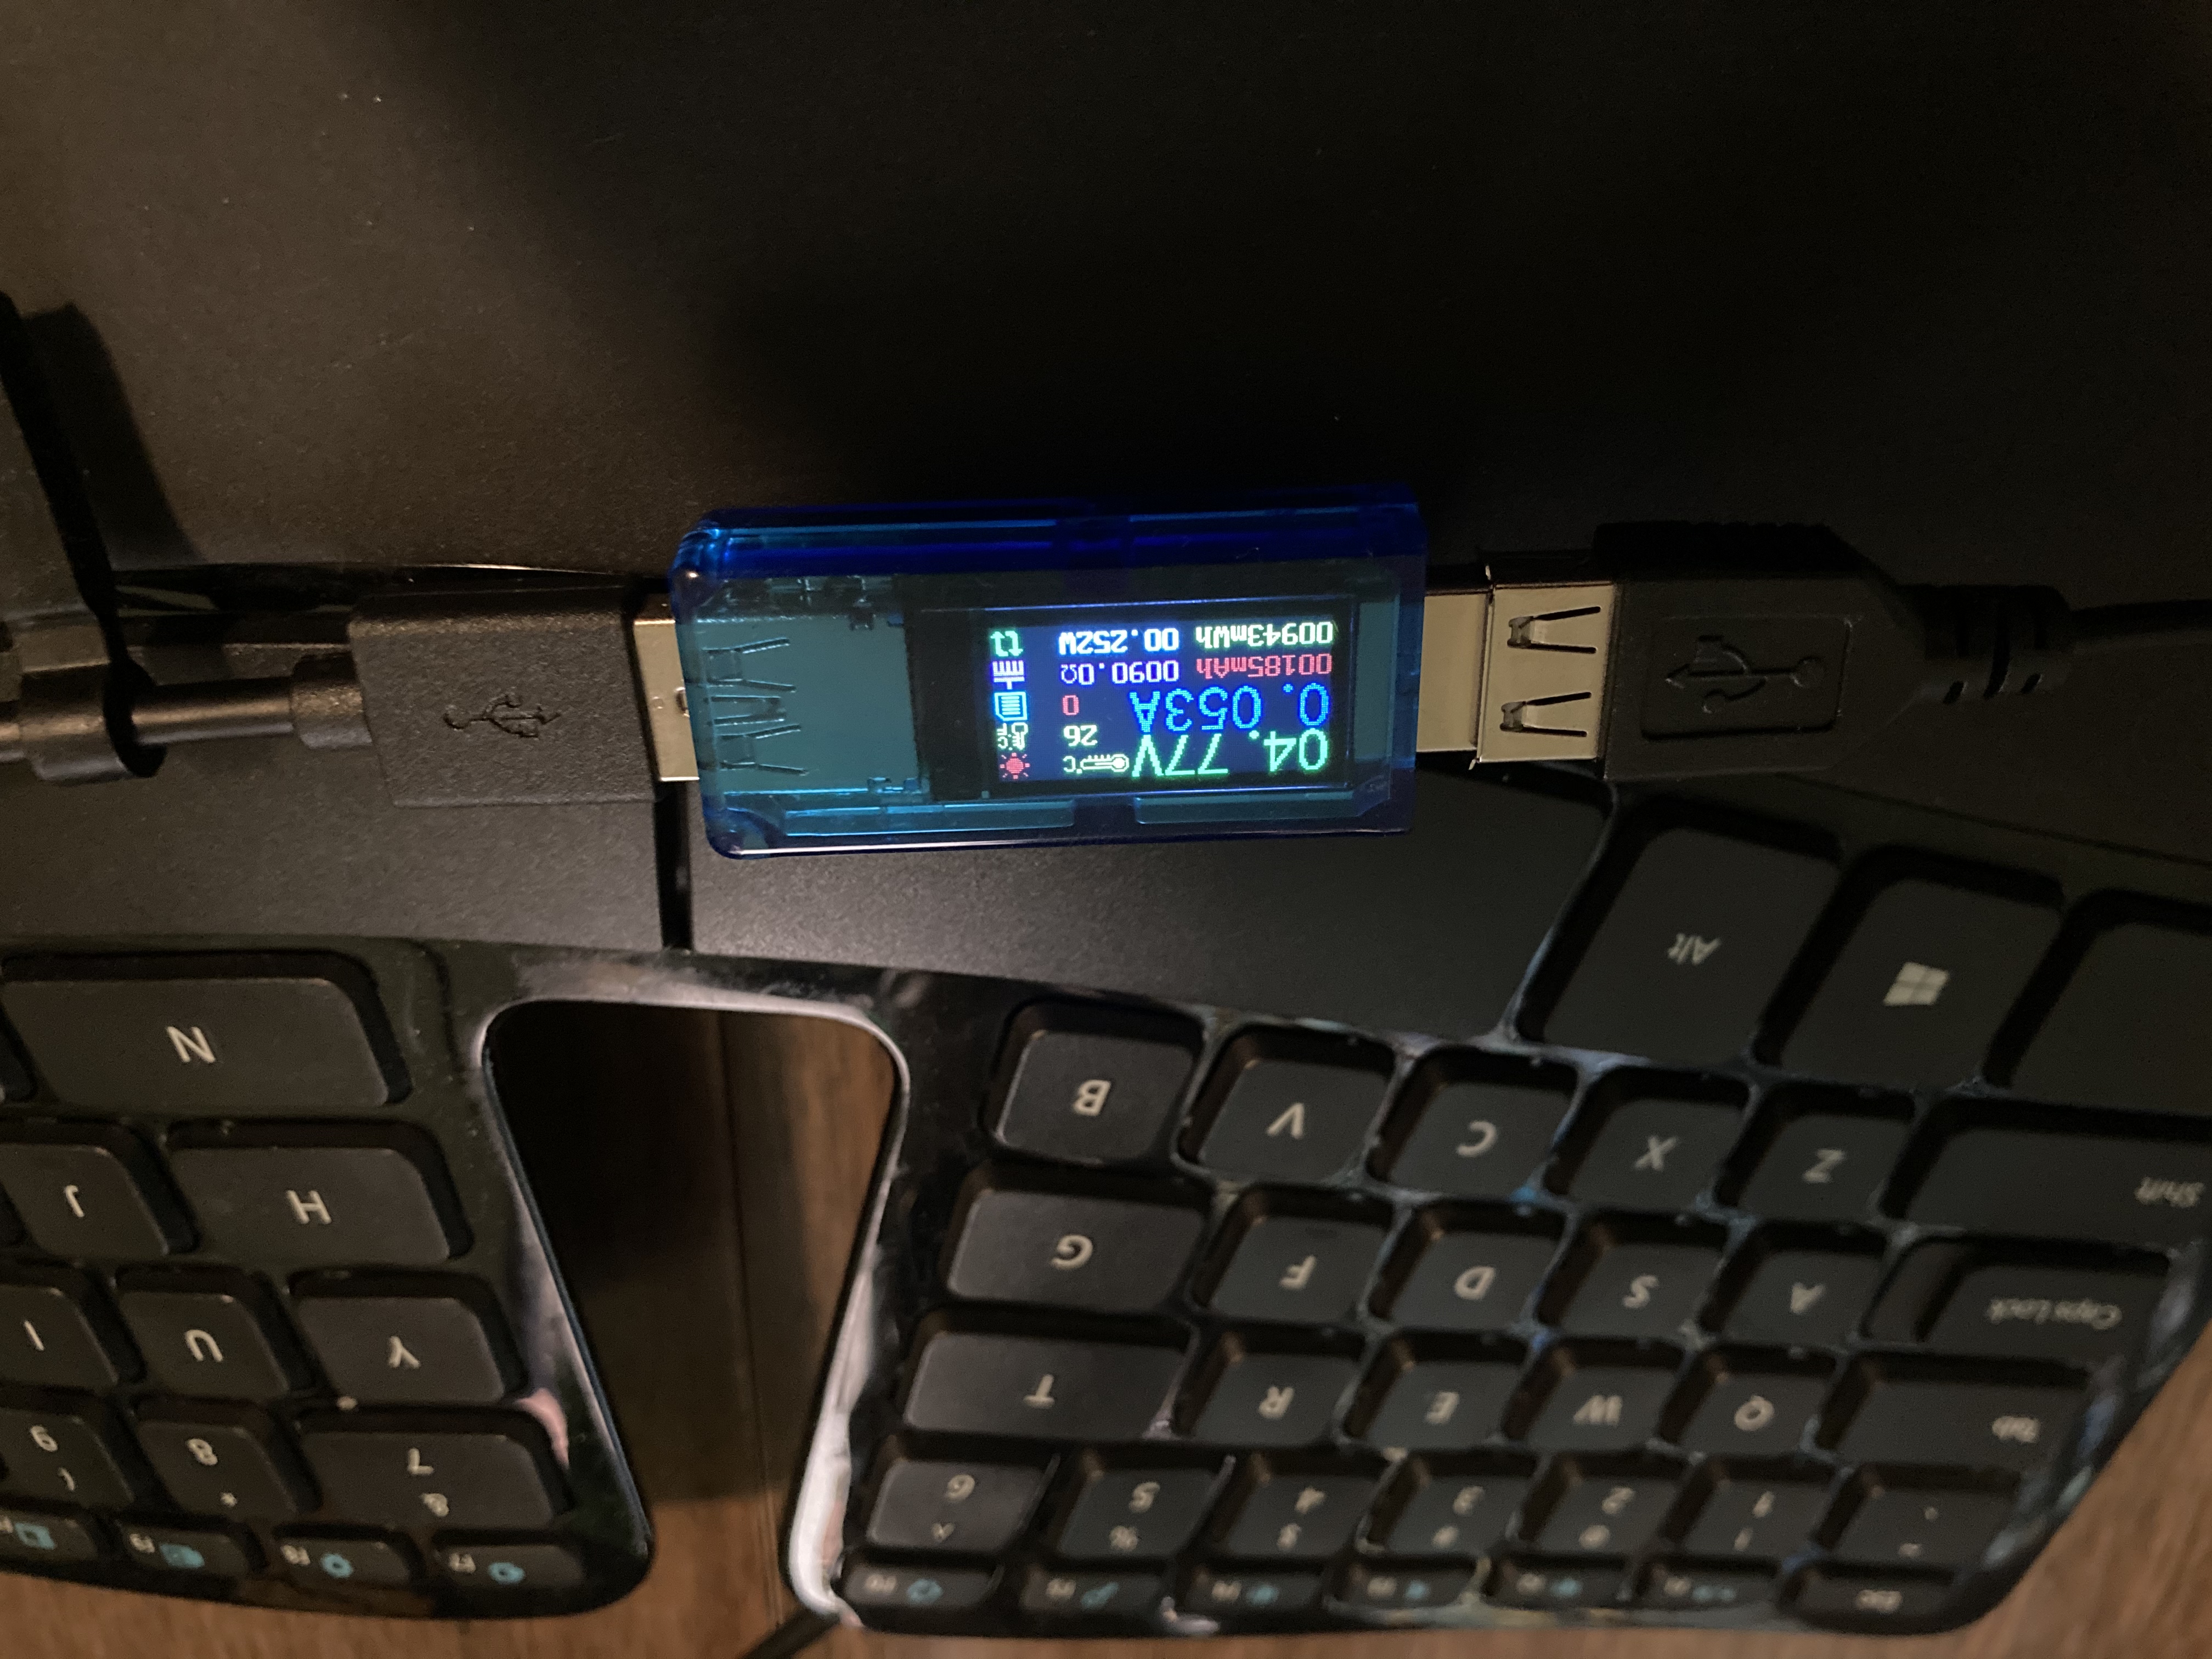
USB power draw The original wireless transceiver draws 20 mA under use and under 100 µA when idle. So I might play around with clocking down to 8 MHz and seeing what subsystems on the microcontroller can be turned off.
With a switching regulator, I could even drop the MCU voltage to 3.3. And as awful as the wireless Sculpt’s sleep behavior was, there’s perhaps opportunity to improve there.
I probably won’t push too hard. I almost never use a wired keyboard on a phone or laptop where it might make a small difference.
Next Steps
Besides reducing power, there are a few improvements I’d like to make:
- The Fn switch (between function keys and volume/brightness/etc.) isn’t functional. I traced the membrane and discovered the switch controls whether pin 1 is pulled down by 47K or by half a megaohm. So I guess, assuming the membrane’s parasitic capacitance, I can detect the switch’s state by driving it high and measuring how long until it drops low.
- The green LED has reversed polarity from the red! To drive them both at once, I’ll have to set the ground pin at maybe half VCC and treat red active-high and green active-low. That might complicate the Fn switch, since it’s pulled towards this same “ground” voltage. I haven’t figured out what the Microsoft circuit does.
- Next time, I’ll put all LEDs on PWM pins. They’re a bit too bright, and breathing would be fun.
- I’d like a better-fitting ribbon cable connector. One that closes more nicely onto the ribbon. And while I appreciate being forced to learn the magic of flux, it would be nice if it came correctly soldered to the pads.
- Given tantalum is a rare earth metal, it might be nice to replace it with a ceramic and maybe a 4 Ω resistor in series. I’d love any input here.
- I’ve always kind of wanted a USB 2 hub like old keyboards used to have? Hub controllers are only a couple bucks…
- Pretty up the traces on the board. :) They should look as clean as Nilaus makes his Factorio belts.
Closing Thoughts
This was a ton of fun. Electronics is so hands-on and as someone who never held interest in Maker Faire or any of that community, I get it now. Connecting software to the real world feels so empowering.
What exploded my mind the most was how accessible hardware design is these days. Download the open source KiCad, pick some inexpensive parts on Digi-Key, send it off to a manufacturer, and for not that many dollars, you have a functioning board!
Now I stare at duct vents and wonder if I could just hook up a microcontroller and a servo to reduce home energy usage.
